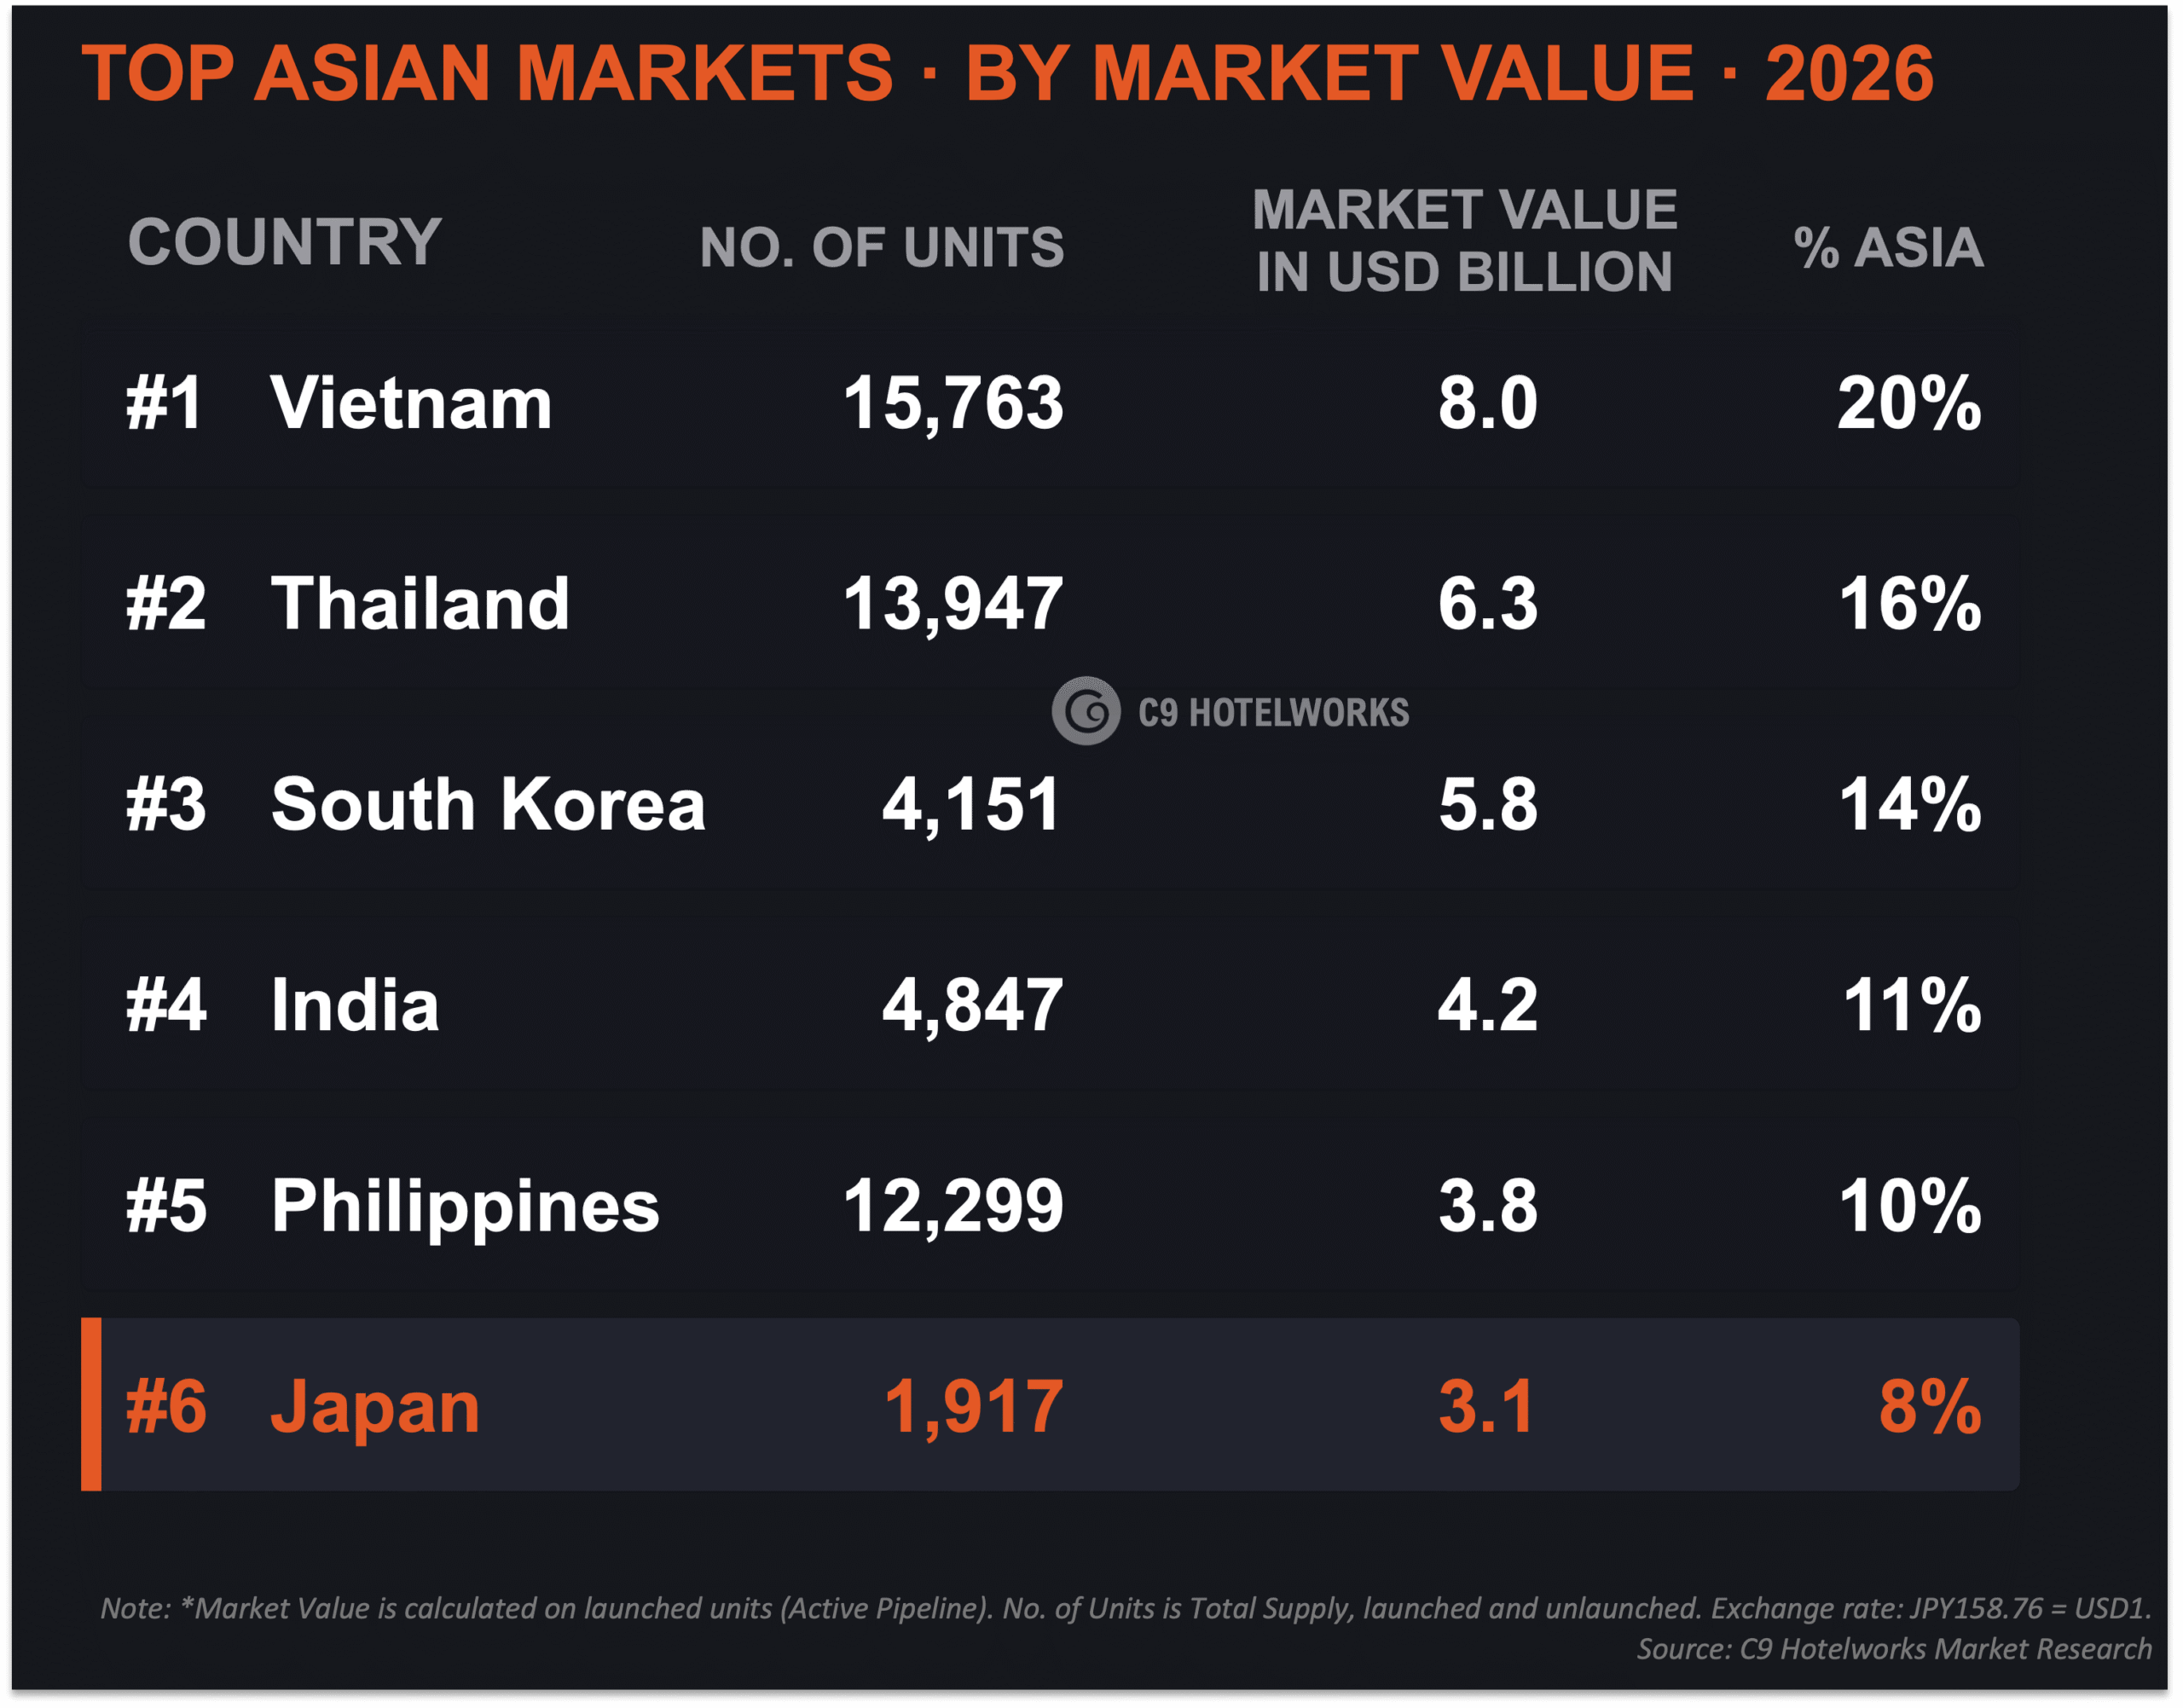
Japan is Asia’s sixth-largest branded residences market by value at USD3.1 billion, reaching 1,012 launched units, 2% of the regional total, at an average sales price of JPY481 million (USD3 million) per unit. The Japan Branded Residences Market Review 2026 examines national supply by destination and product type, with a focus on Niseko and Japan’s alpine resort markets. The review also covers rental yields, capital growth, construction costs, currency movements and transport access. Resort destinations account for 91% of the 1,917 units in total supply, and Niseko alone holds 57%.
Key Sections Covered
- Japan’s Position in Asia’s Branded Residences Market by Value and Supply
- Japan Branded Residences Supply by Destination, Product Type and Completion Year
- Niseko Branded Residences, Residential Supply and New International Air Services
- Rental Yield, Capital Growth, Construction Costs, the Yen and Alpine Markets Beyond Niseko
Investor Highlights
1. Japan Ranks Sixth in Asia by Value on 2% of Launched Units
Japan’s branded residences market value reached USD3.1 billion (JPY487 billion) in 2026, sixth in Asia and 8% of the region’s market value. Vietnam leads at USD8.0 billion, followed by Thailand (USD6.3 billion), South Korea (USD5.8 billion), India (USD4.2 billion) and the Philippines (USD3.8 billion). This value comes from 1,012 launched units, 2% of Asia’s 50,025 launched units. Its average sales price of JPY481 million (USD3 million) per unit is the second highest among Asia’s branded residences markets, and 68% of properties sit in the luxury tier.
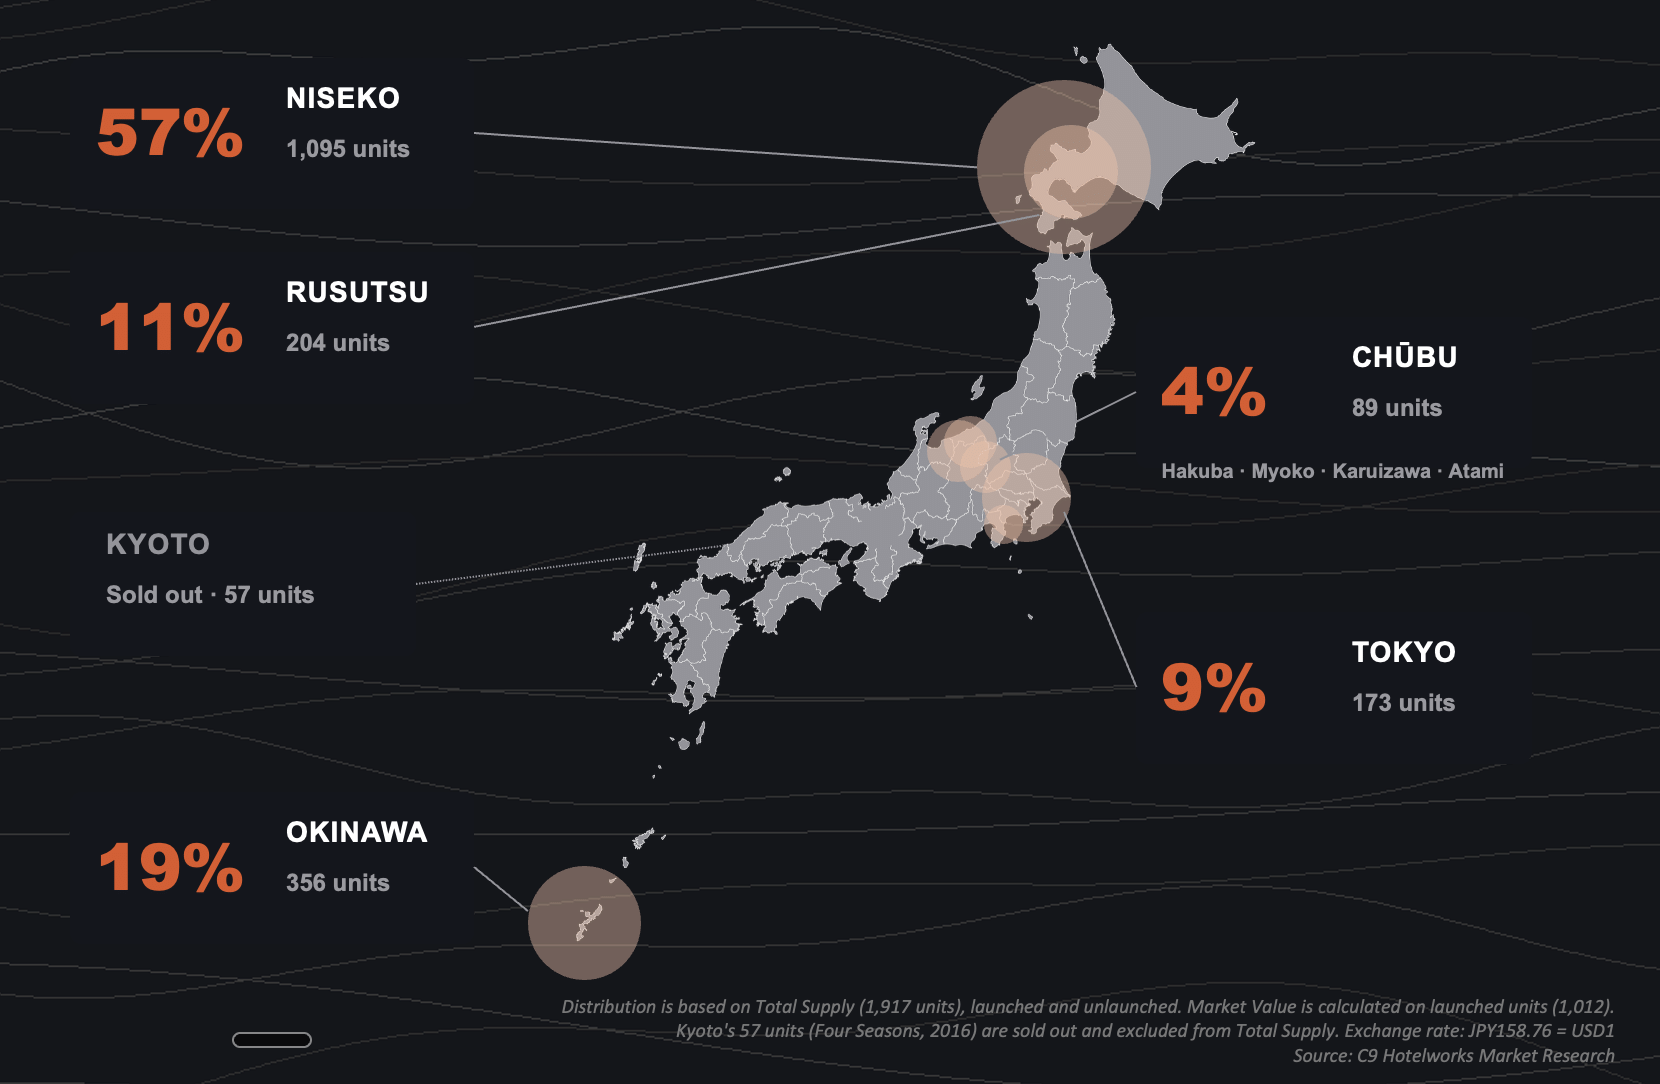
Resort destinations account for 91% of the 1,917 units in Total Supply and urban destinations 9%, with 72% of supply in alpine resort destinations. Niseko holds 1,095 units, followed by Okinawa at 356, Rusutsu at 204, Tokyo at 173 and the Chūbu region at 89, while Kyoto’s 57 units are sold out. Condominiums make up 87% of supply, hybrid schemes 8% and landed properties 5%, and 596 units are scheduled for completion in 2026.
2. Niseko Remains Japan’s Leading Branded Residences Market as New Air Services Arrive
Niseko holds 57% of Japan’s branded residences supply, 1,095 of 1,917 units. Winter visitor arrivals across Kutchan, Niseko and Rankoshi rose 8.4% year-on-year to 2.14 million between October 2025 and March 2026, and hotel supply grows 18% in 2026, from 1,727 to 2,037 keys. One Hanazono Villas, comprising 13 Park Hyatt branded villas at Hanazono, was announced in September 2026.
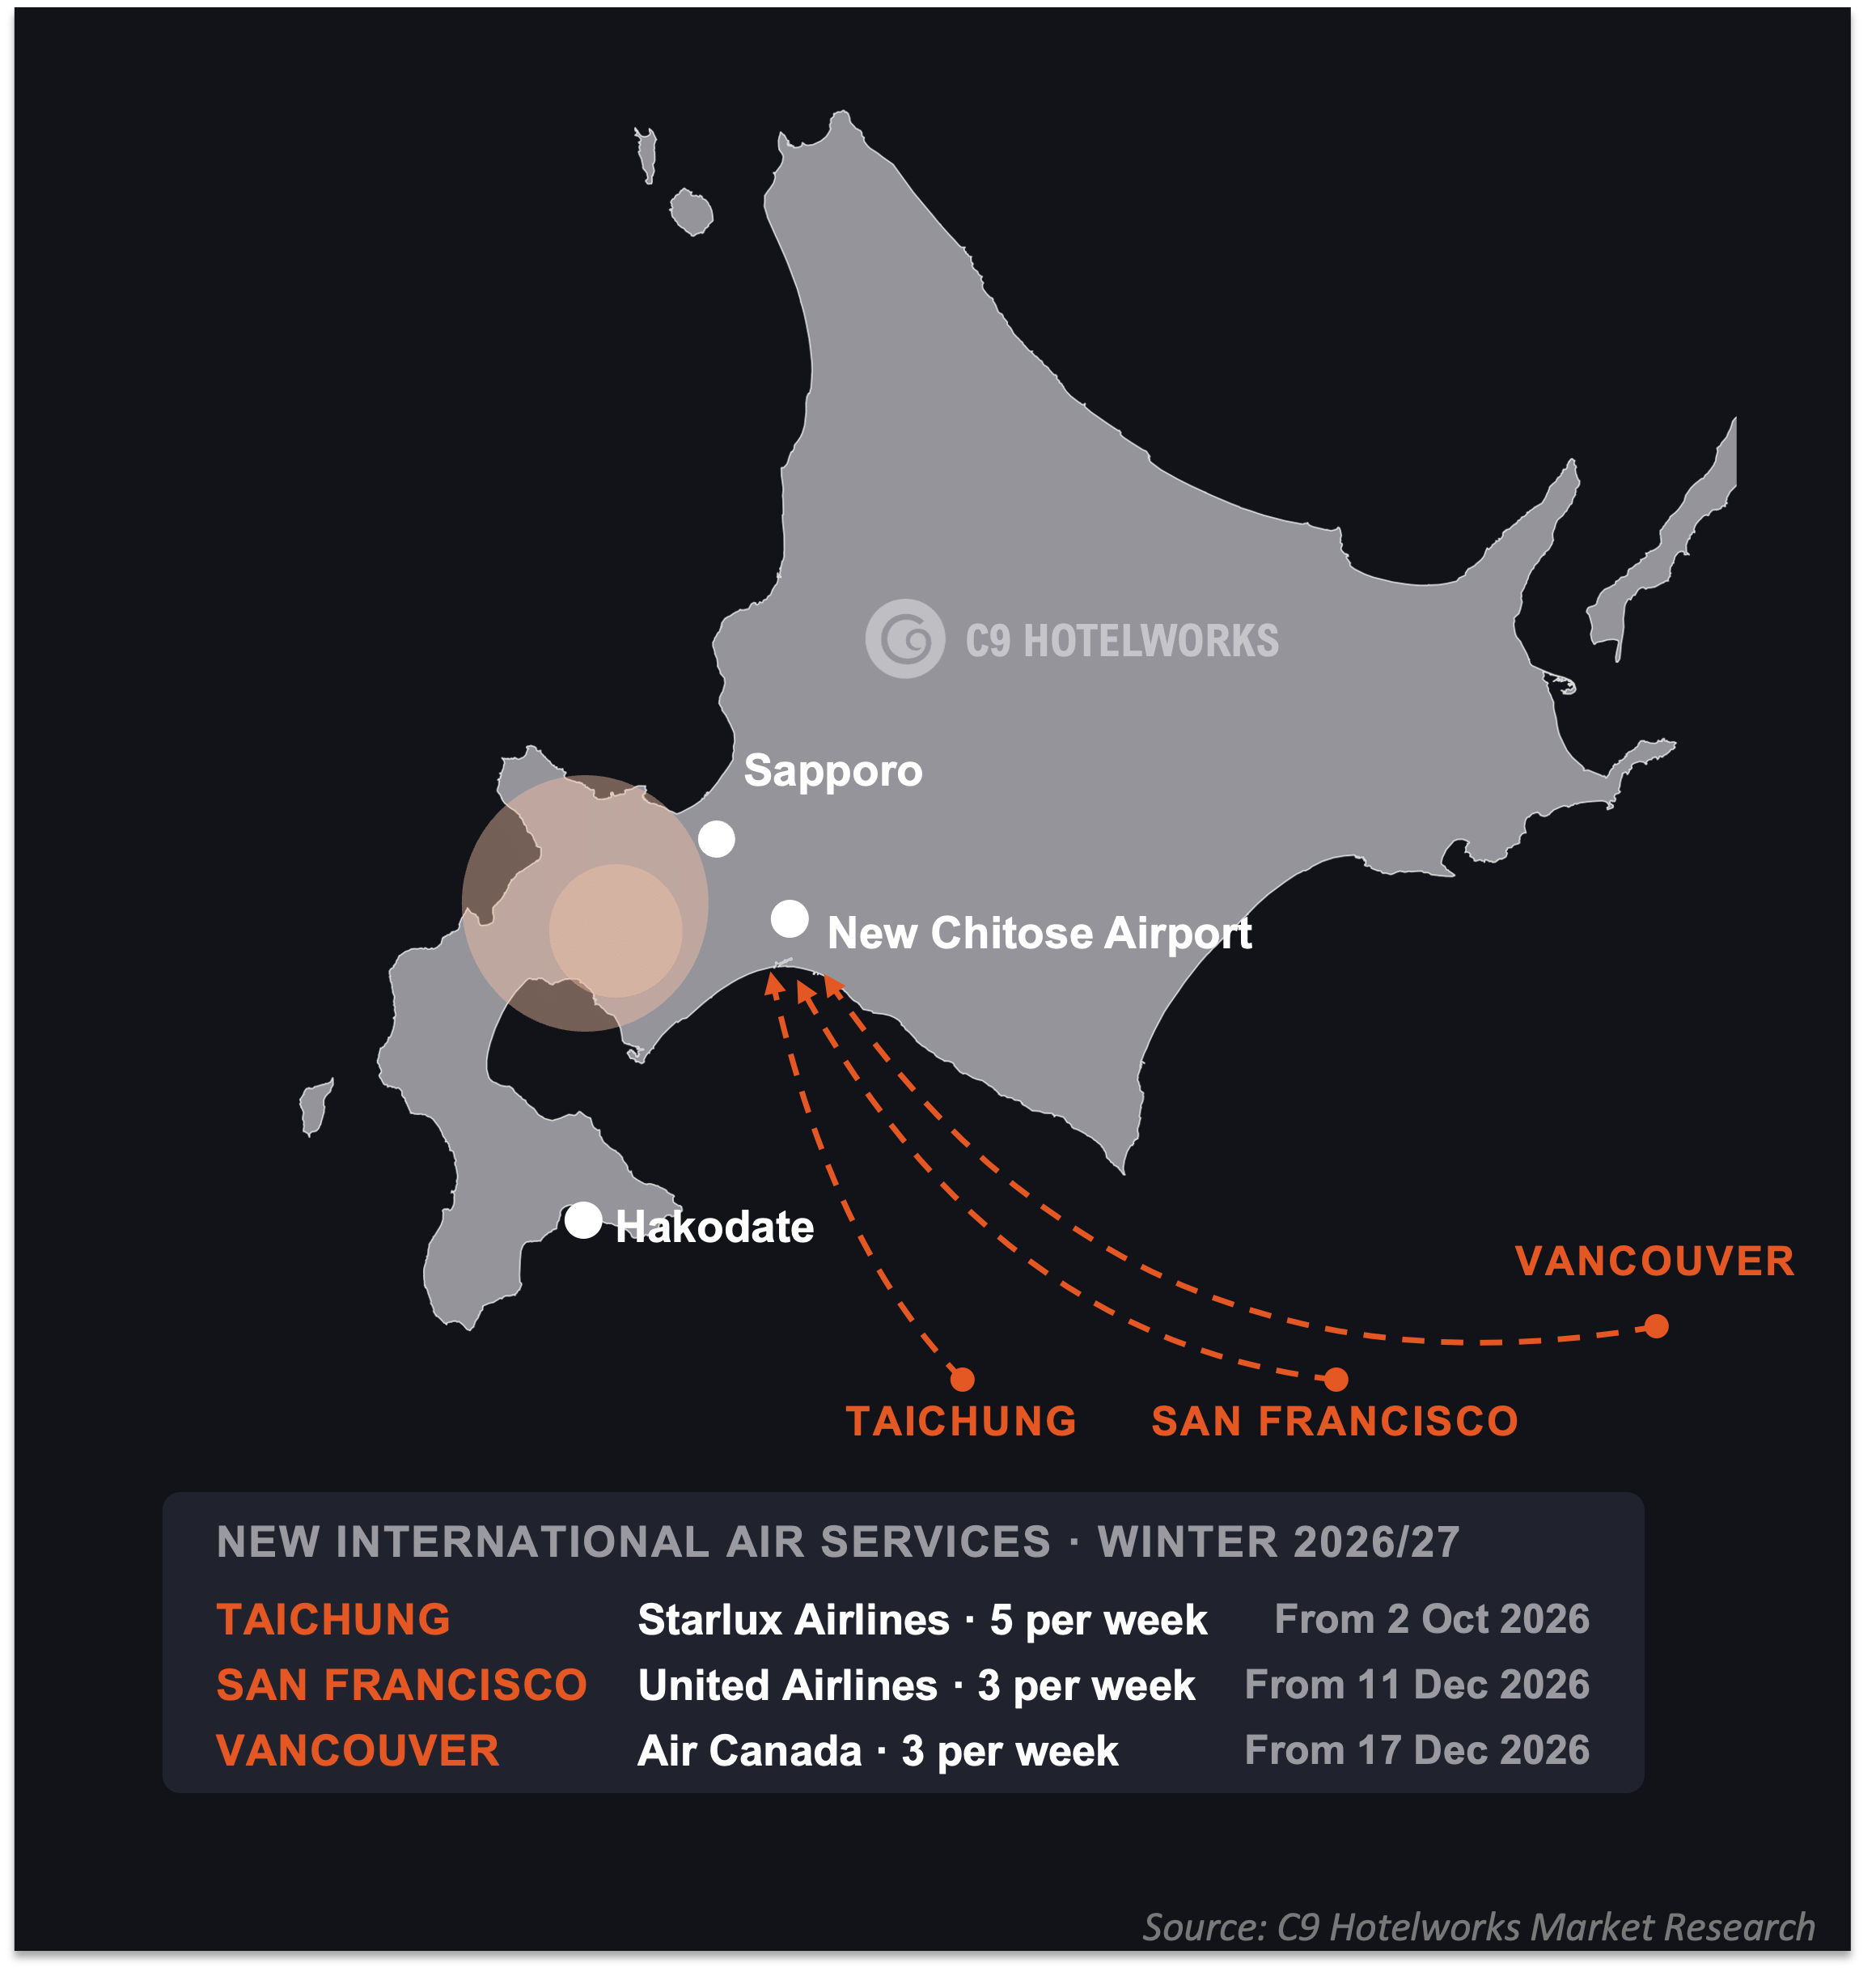
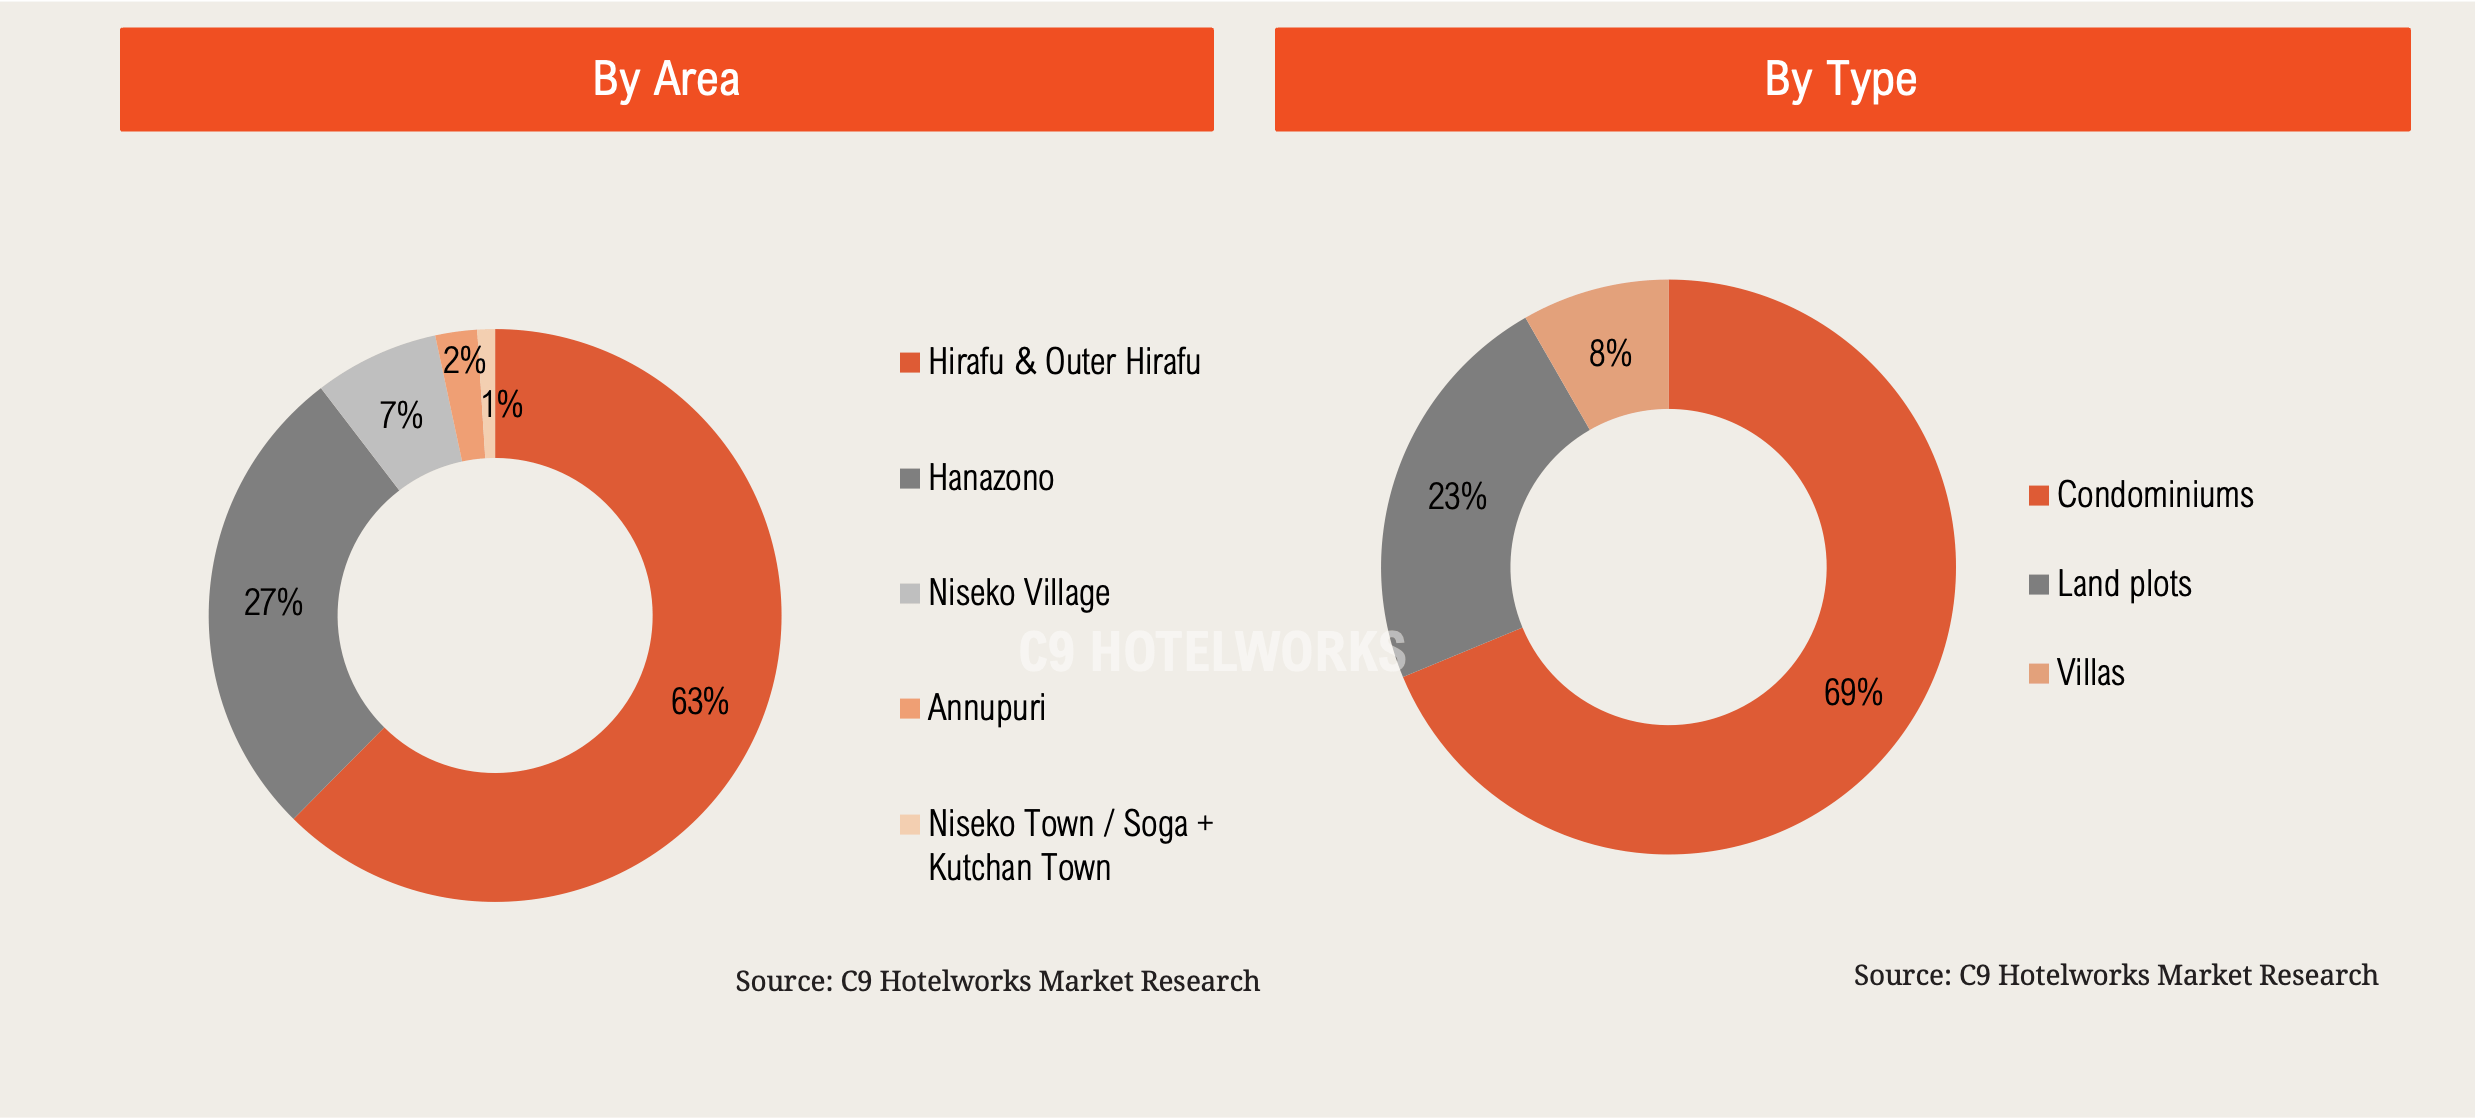
Across all Niseko residential supply, Hirafu and Outer Hirafu account for 63%, Hanazono 27%, Niseko Village 7% and Annupuri and Kutchan 3%. Condominiums represent 69%, land plots 23% and villas 8%. Excluding Hotel101 Niseko and its 482 condotel units, the mix is condominiums 45%, land plots 41% and villas 14%. Three new international air services reach New Chitose Airport in winter 2026/27: STARLUX Airlines from Taichung at five weekly flights from 2 October 2026, United Airlines from San Francisco from 11 December and Air Canada from Vancouver from 17 December, each at three weekly flights.
3. Capital Growth Outweighs Rental Yield Appeal
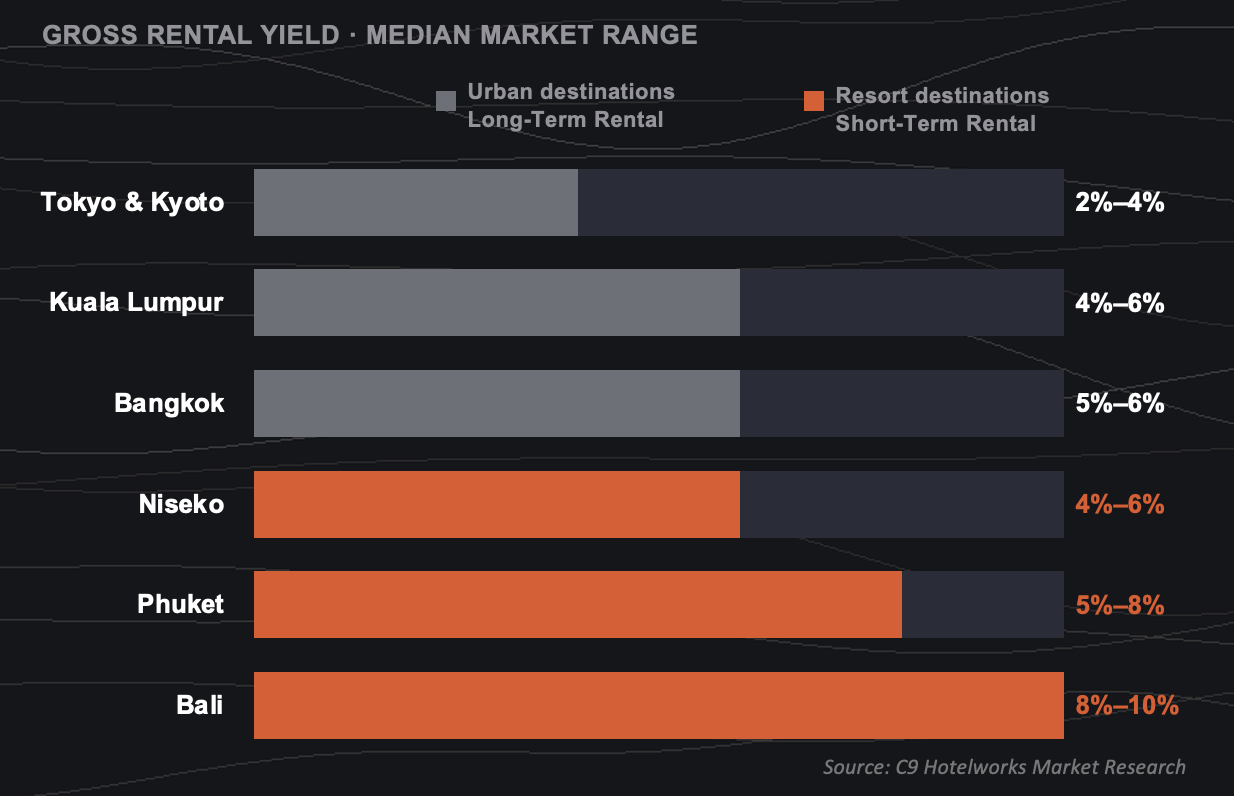
Rental income is hard to earn in Japan. Short-term rental has been capped at 180 days a year since June 2018, about 60 days in parts of Kyoto and zero in designated areas, and only a licensed hotel building can rent year-round. Gross rental yields in Tokyo range from 2% to 4% on long-term rental, against 4% to 6% in Kuala Lumpur and 5% to 6% in Bangkok. In resort destinations, Niseko achieves 4% to 6% on short-term rental, against 5% to 8% in Phuket and 8% to 10% in Bali.
Buyers in urban destinations are domestic-led end-users buying a primary or secondary residence, while resort buyers are international-led and buy holiday homes for seasonal use. What they are buying is capital growth, and land prices show it. In the July 2026 survey (1 July 2025 to 1 July 2026), residential land prices rose in every alpine destination tracked — from 4.3% in Rusutsu and 8.7% in Kutchan to 18.5% in Myoko, 31.3% in Hakuba and 32.0% in Furano, against a national average of 1.0%.
4. Construction Costs Rise 35% as a Weaker Yen Lowers Prices for Dollar Buyers
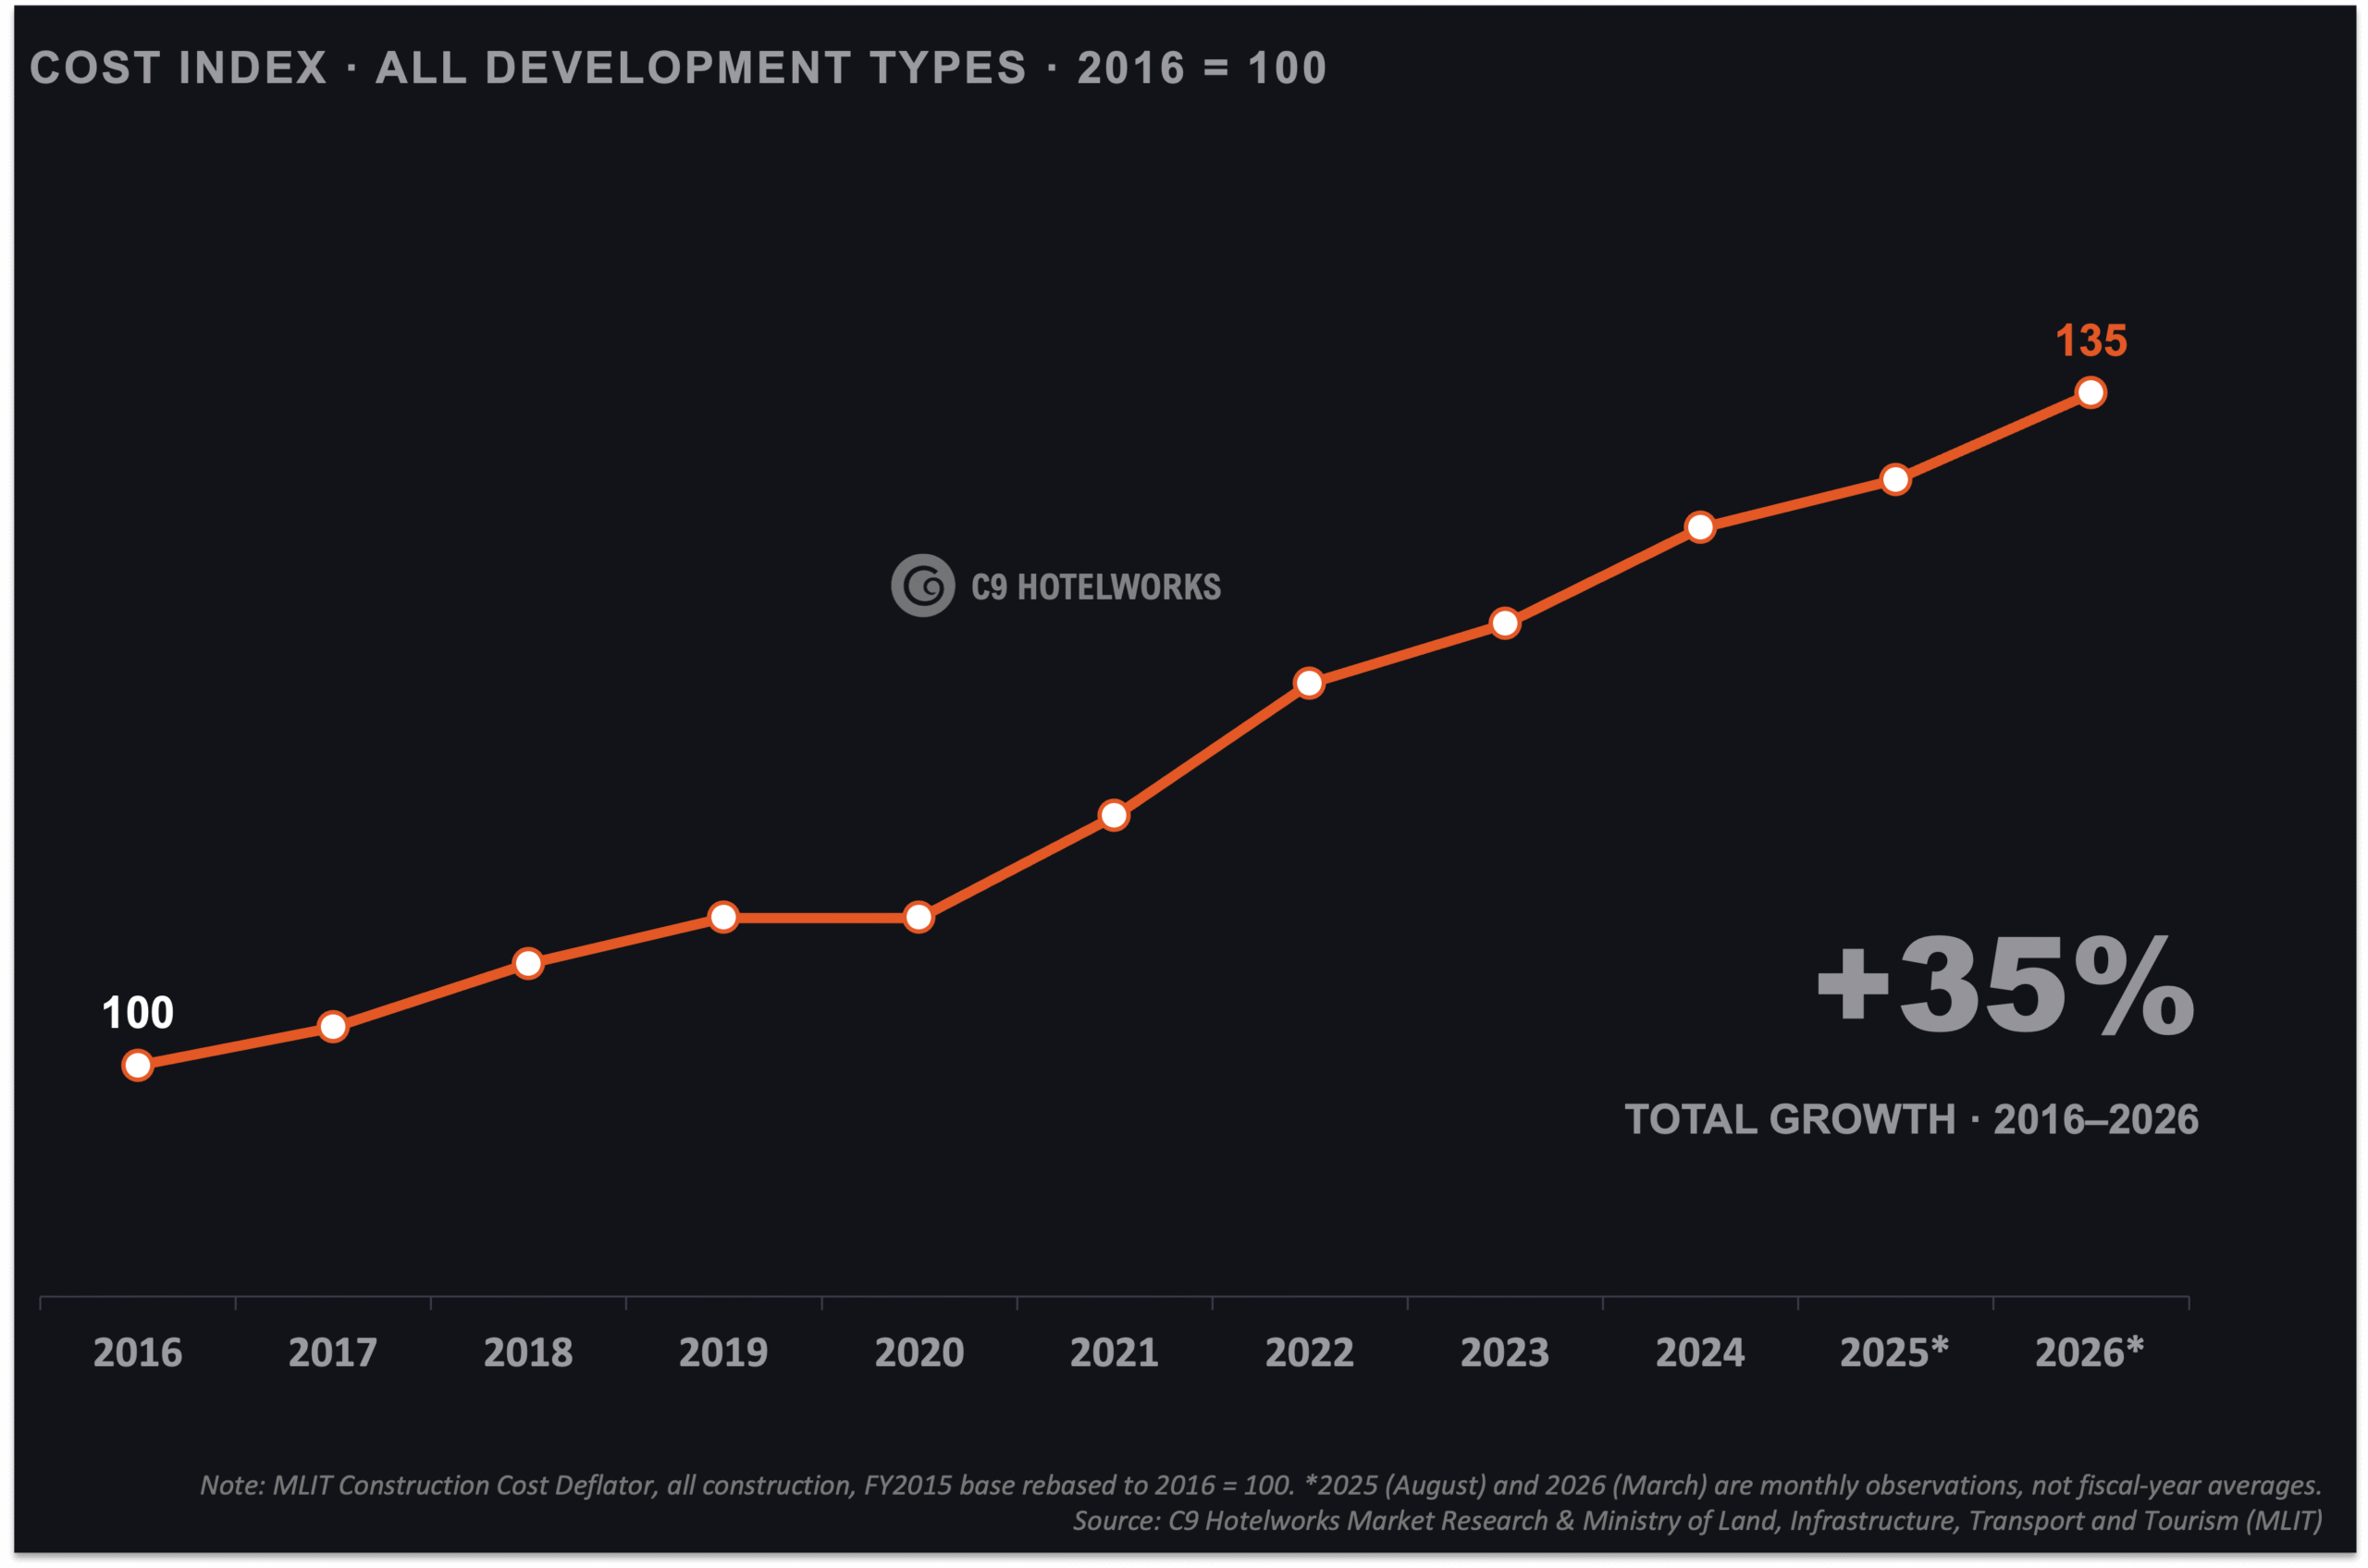
Japan’s construction cost index for all development types reached 135 in March 2026 (2016 = 100), a 35% increase, with a compound annual growth rate of 3.6% from 2021 to 2026. Costs rose 4.9% in 2021 and 6.2% in 2022 on higher material and energy prices. From April 2024 the statutory overtime cap of 45 hours a month and 360 hours a year applies to construction, adding labour cost pressure and extending delivery timelines.
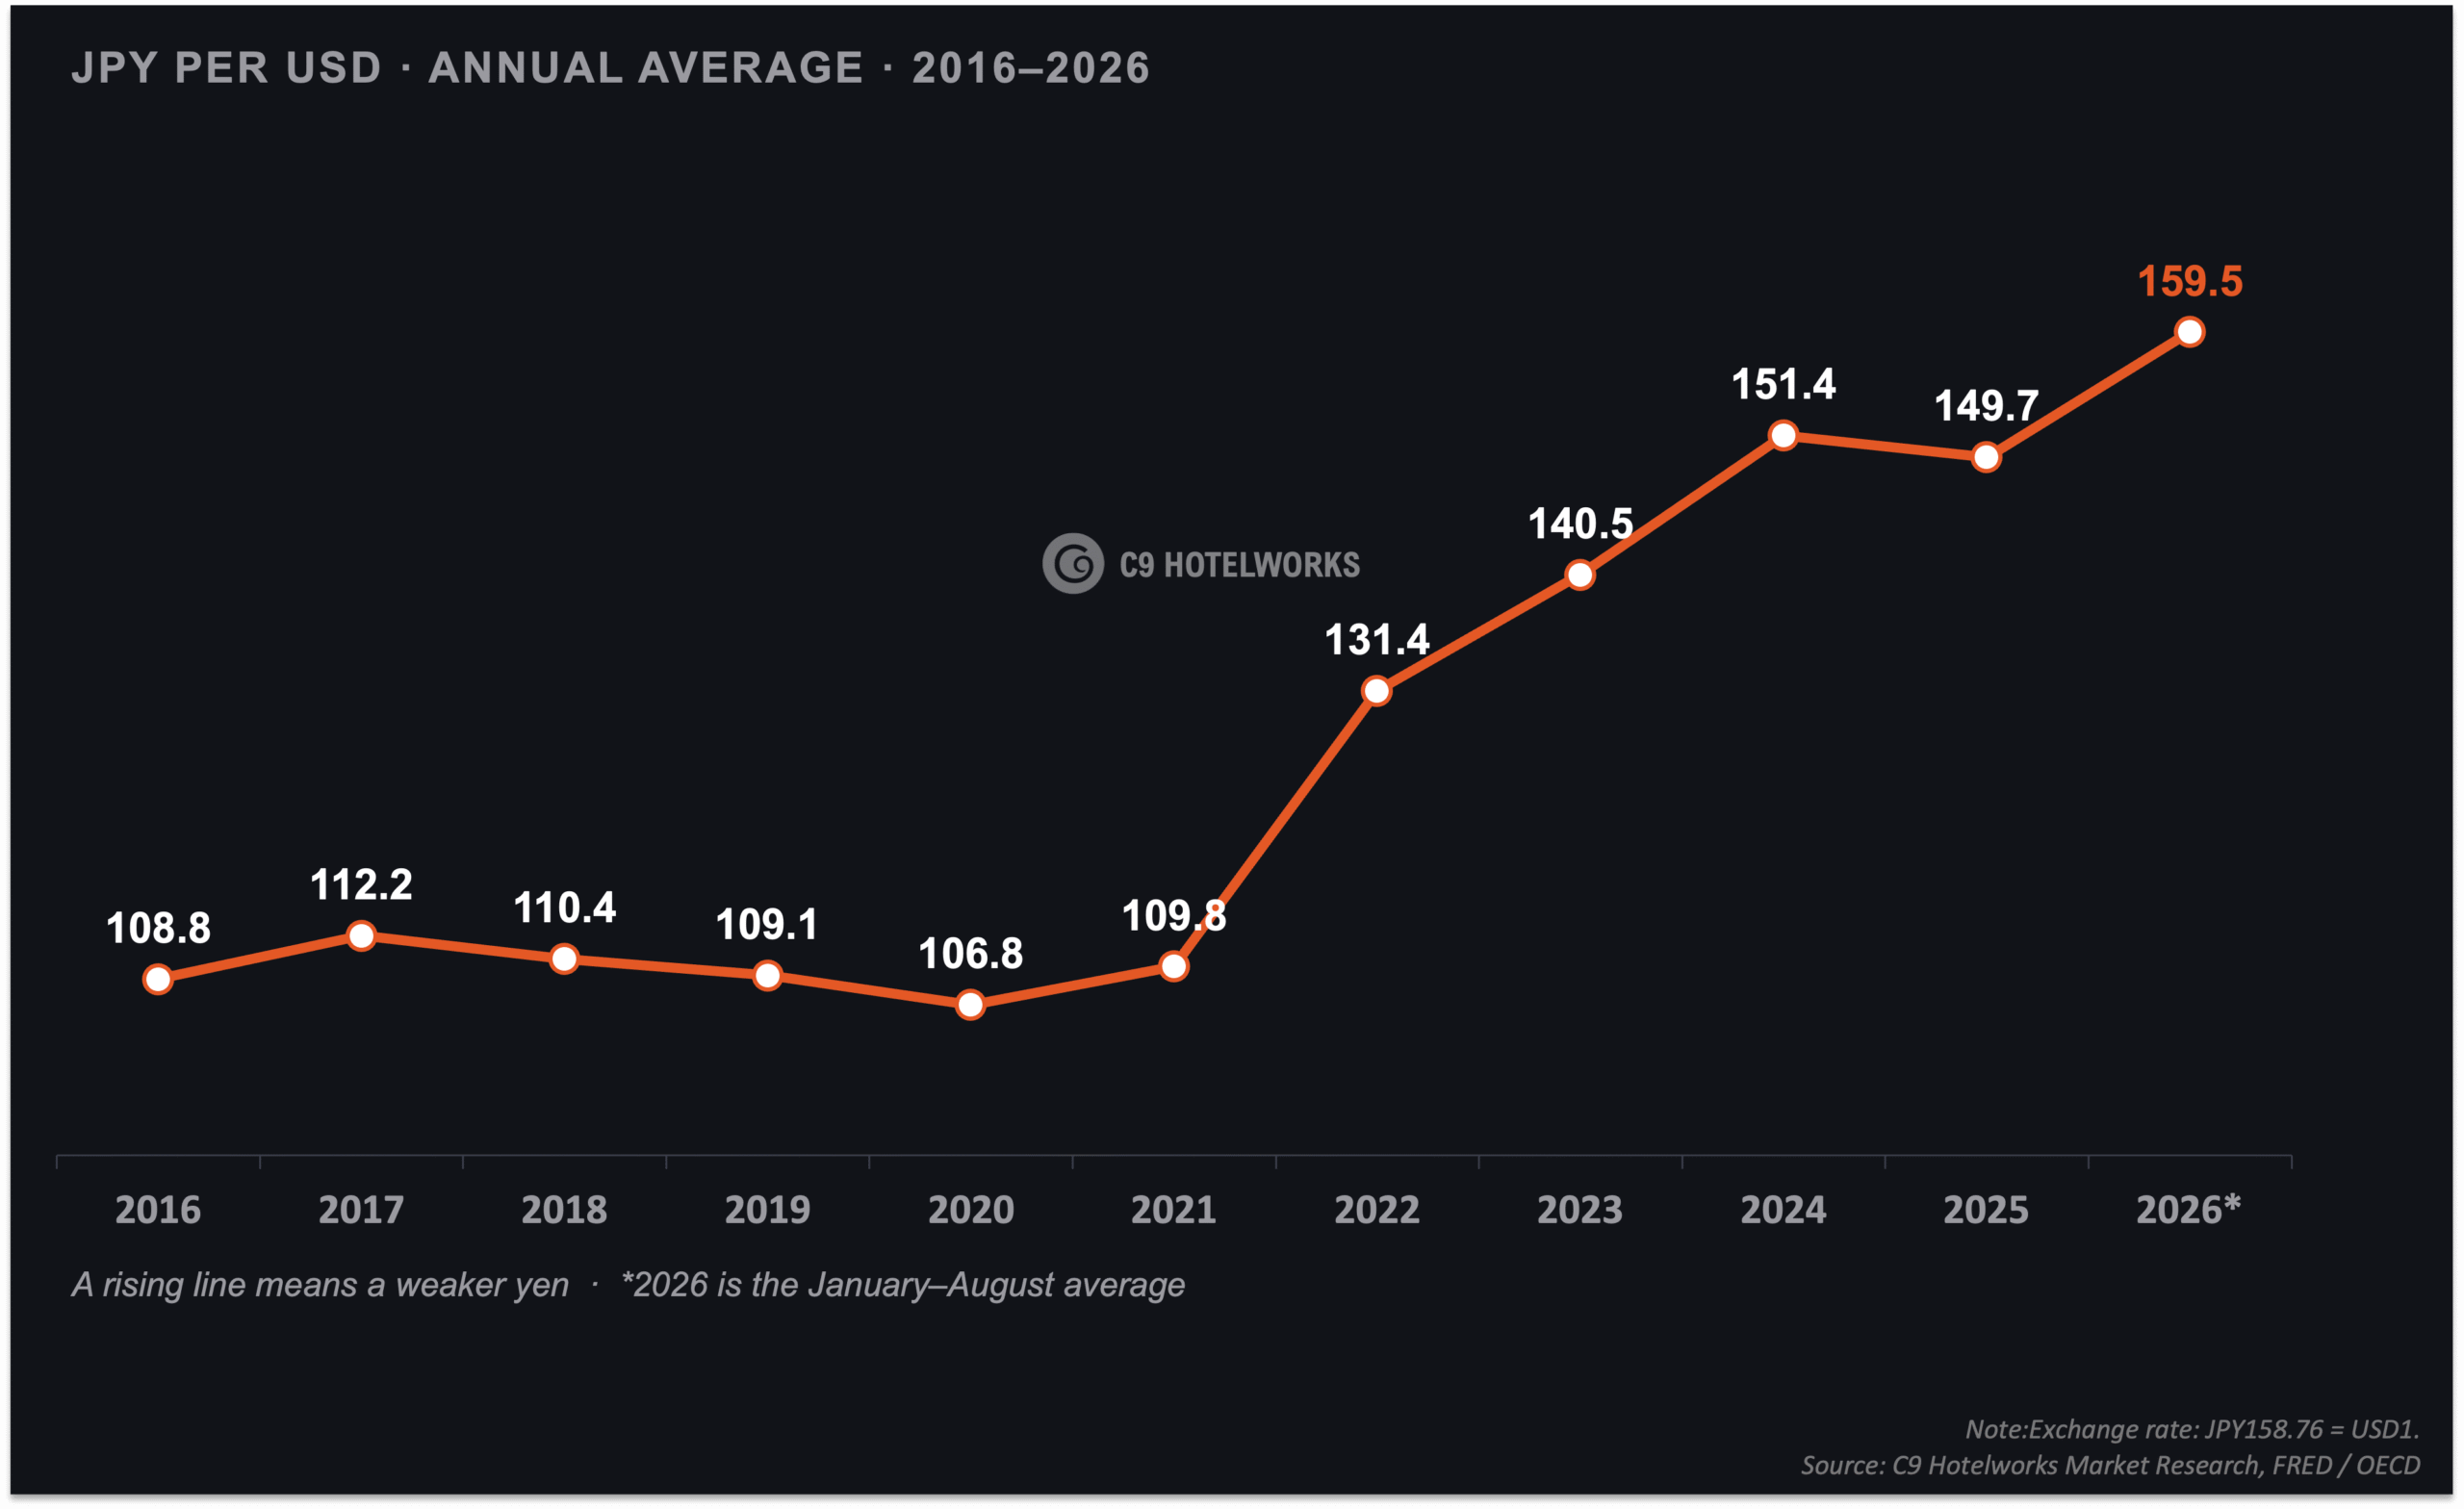
The yen averaged JPY159.5 per USD during January to August 2026, against JPY108.8 in 2016, a 46.6% increase in JPY per USD. A property priced at JPY150 million cost USD1.4 million in 2016 and USD0.94 million in August 2026, a 32% discount on currency alone. The same weaker yen raises the cost of imported materials, so currency lowers the entry price for international buyers while adding to development costs.
5. Railway Access Remains Crucial to Alpine Markets
Hakuba in Nagano recorded Japan’s second-highest residential land price increase in the July 2026 Prefectural Land Price Survey, at 31.3% year-on-year, reaching JPY17,600 per square metre at Hokujo. Commercial land at Hakuba Station rose 35.6%, the highest in Japan. Winter ski resort visitors across the ten Hakuba Valley resorts reached 1.9 million in 2025/26, up 3%. Hakuba is about one hour by road from Nagano station on the Hokuriku Shinkansen, and Banyan Tree Hakuba is targeting 2028.
Myoko Kogen in Niigata recorded an 18.5% residential land price increase at Sekikawa, the largest rise in the prefecture, with ski resort visitors in Myoko city at 0.7 million, up 4.5%. Joetsu-Myoko station is 80 to 110 minutes from Tokyo, then about one hour by road. Patience Capital Group is developing a mixed-use resort of hotels, residences and retail, with Six Senses Myoko targeting 2028 as phase one.
Niseko is different. The Hokkaido Shinkansen extension to Kutchan has moved from FY2030 to about FY2038, so access is by air through New Chitose Airport. Rail is an advantage for Hakuba and Myoko, not a requirement for Niseko.
Niseko’s winter growth is concentrated at the start and end of the season rather than at its January peak, while hotel supply rises 46% to 2,519 keys by the end of 2026. The Niseko Tourism, Hotel & Property Market Review 2026 examines tourism demand, hotel performance and residential supply across Kutchan, Niseko and Rankoshi. Winter visitor arrivals rose 8.4% year-on-year to 2.14 million during the November 2025 to March 2026 season.
Key Sections Covered
- Niseko Tourism Demand, Length of Stay and International Source Markets
- Niseko Hotel Performance, January to July 2026
- Residential Supply by Area and Type
- Key Market Changes for Winter 2026/27, C9 Insider Opinions and the Development Pipeline to 2031
Investor Highlight
1. Winter Visitor Arrivals Rise 8.4% as Longer Stays Gain Share
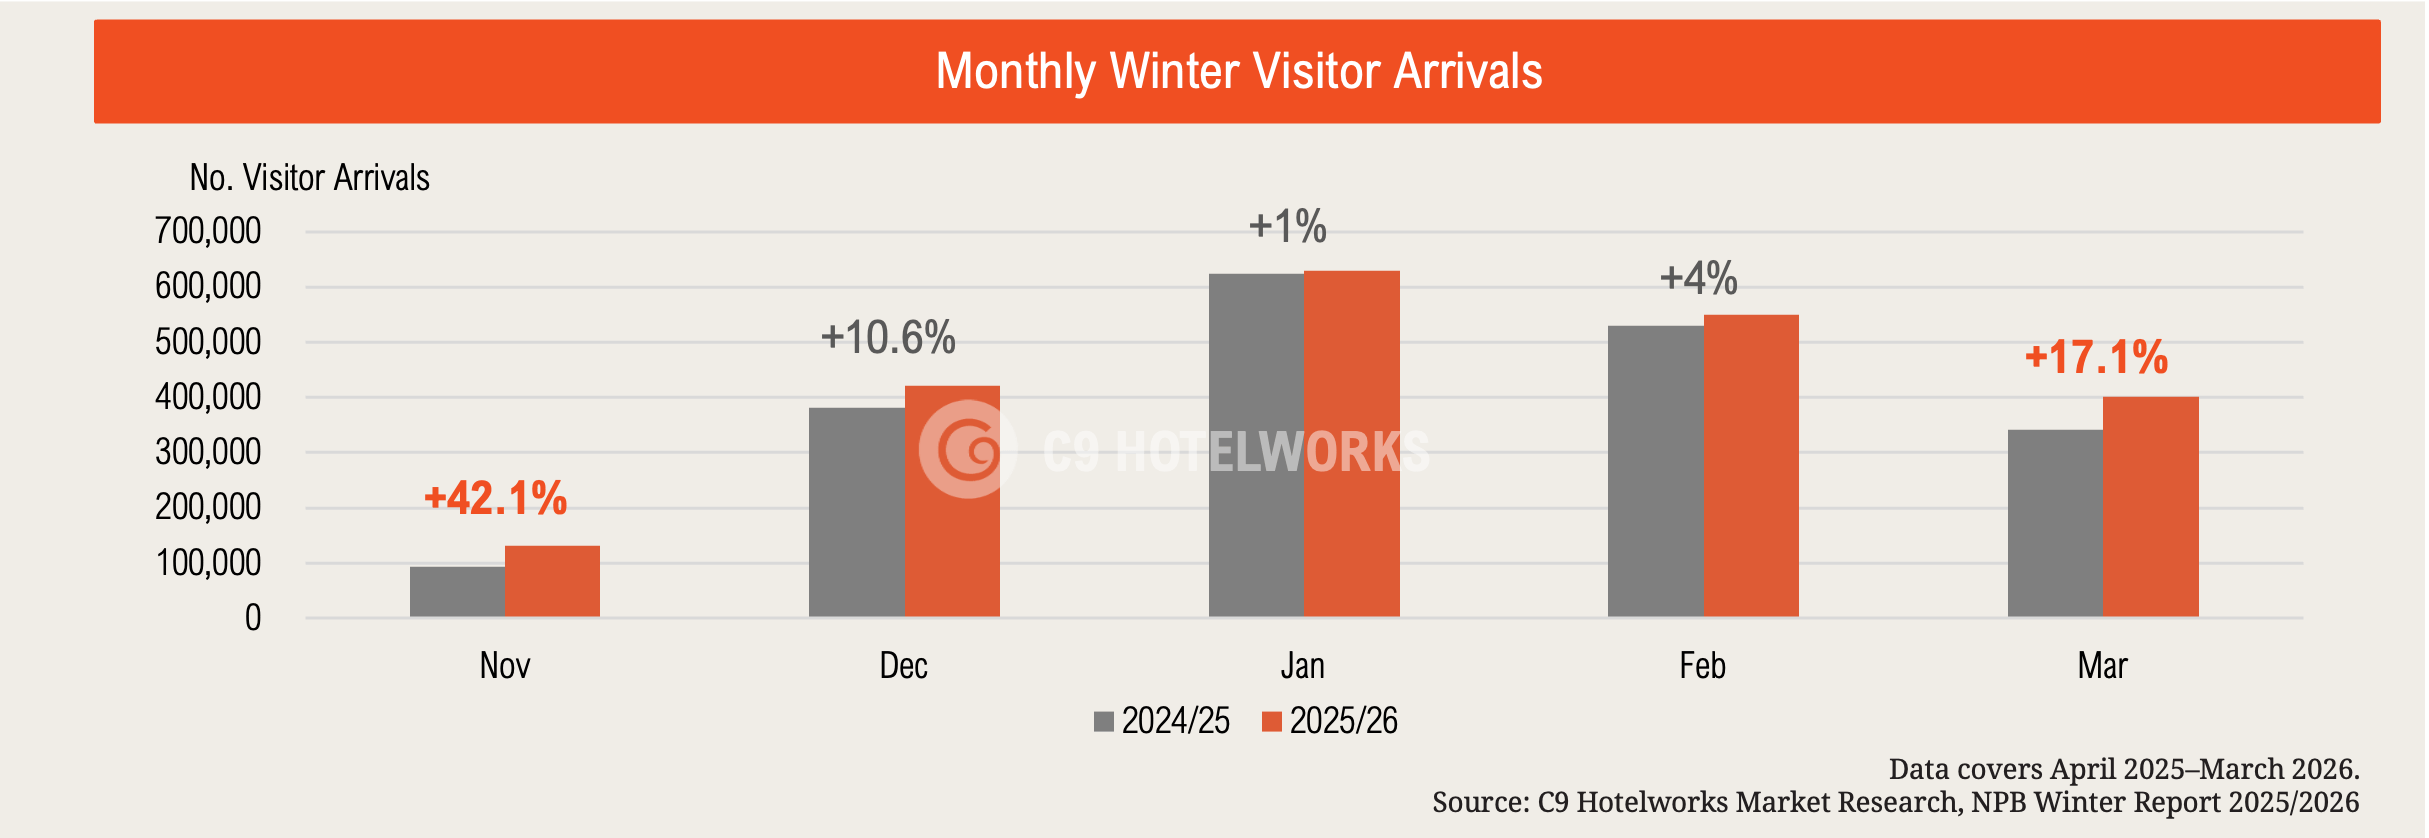
Visitor arrivals across Kutchan, Niseko and Rankoshi reached 2.14 million during the November 2025 to March 2026 winter season, up 8.4% year-on-year. January remained the highest-volume month at 630,200 arrivals, while November posted the strongest growth at 42.1% and March rose 17.1%, concentrating the season’s gains at its two ends.
During April 2025 to March 2026, 87.6% of international overnight guests stayed four nights or more and 24.5% stayed eight nights or longer, a 2.8 percentage-point rise. The United States led international overnight guests over the same period at 40,504 guests, up 15.2%, while Australia remained the leading market by winter visitor arrivals.
2. Summer ADR Strengthens as Occupancy Returns to Growth
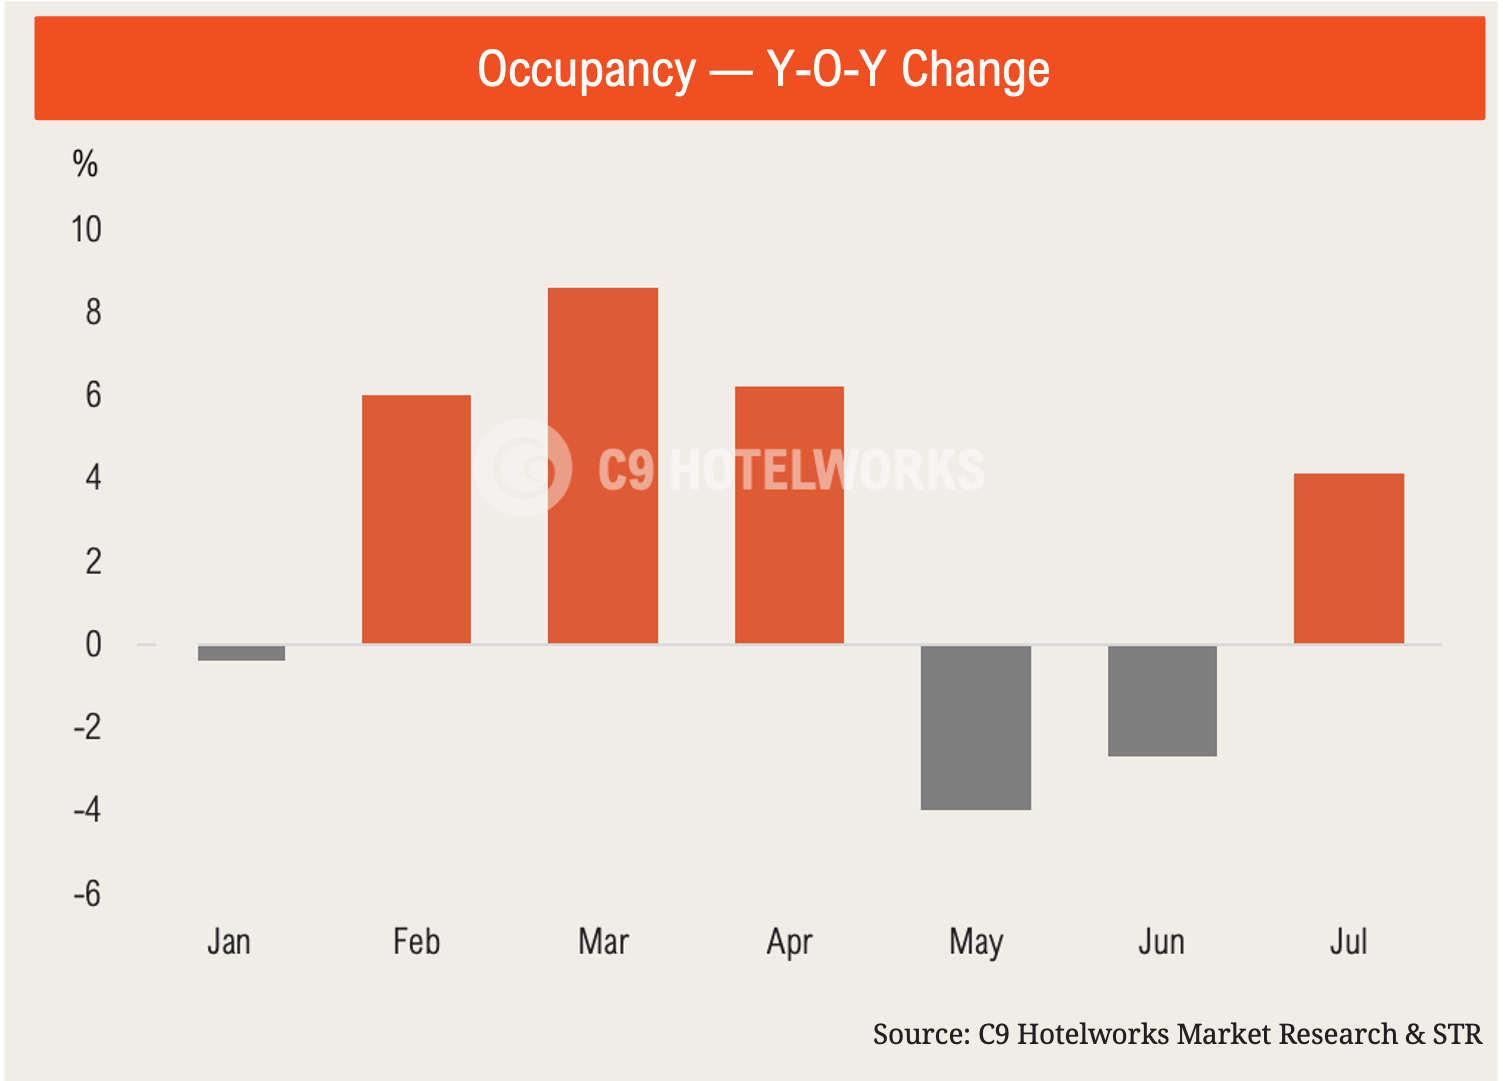
Hotel performance remained seasonal during January to July 2026. Occupancy rose year-on-year from February to April, led by March at 8.6 percentage points, declined in May and June, and returned to growth at 4.1 percentage points in July.
Average daily rate (ADR) increased year-on-year in five of the first seven months, with declines of 4% in January and 8.4% in April before growth accelerated to 10.6% in June and 15% in July. The Osaka World Expo drew domestic travel to Kansai in 2025; its absence in 2026, cooler northern summer conditions and a weak yen returned Japanese leisure demand to Hokkaido.
3. Residential Supply Rises 27.6% in 2026
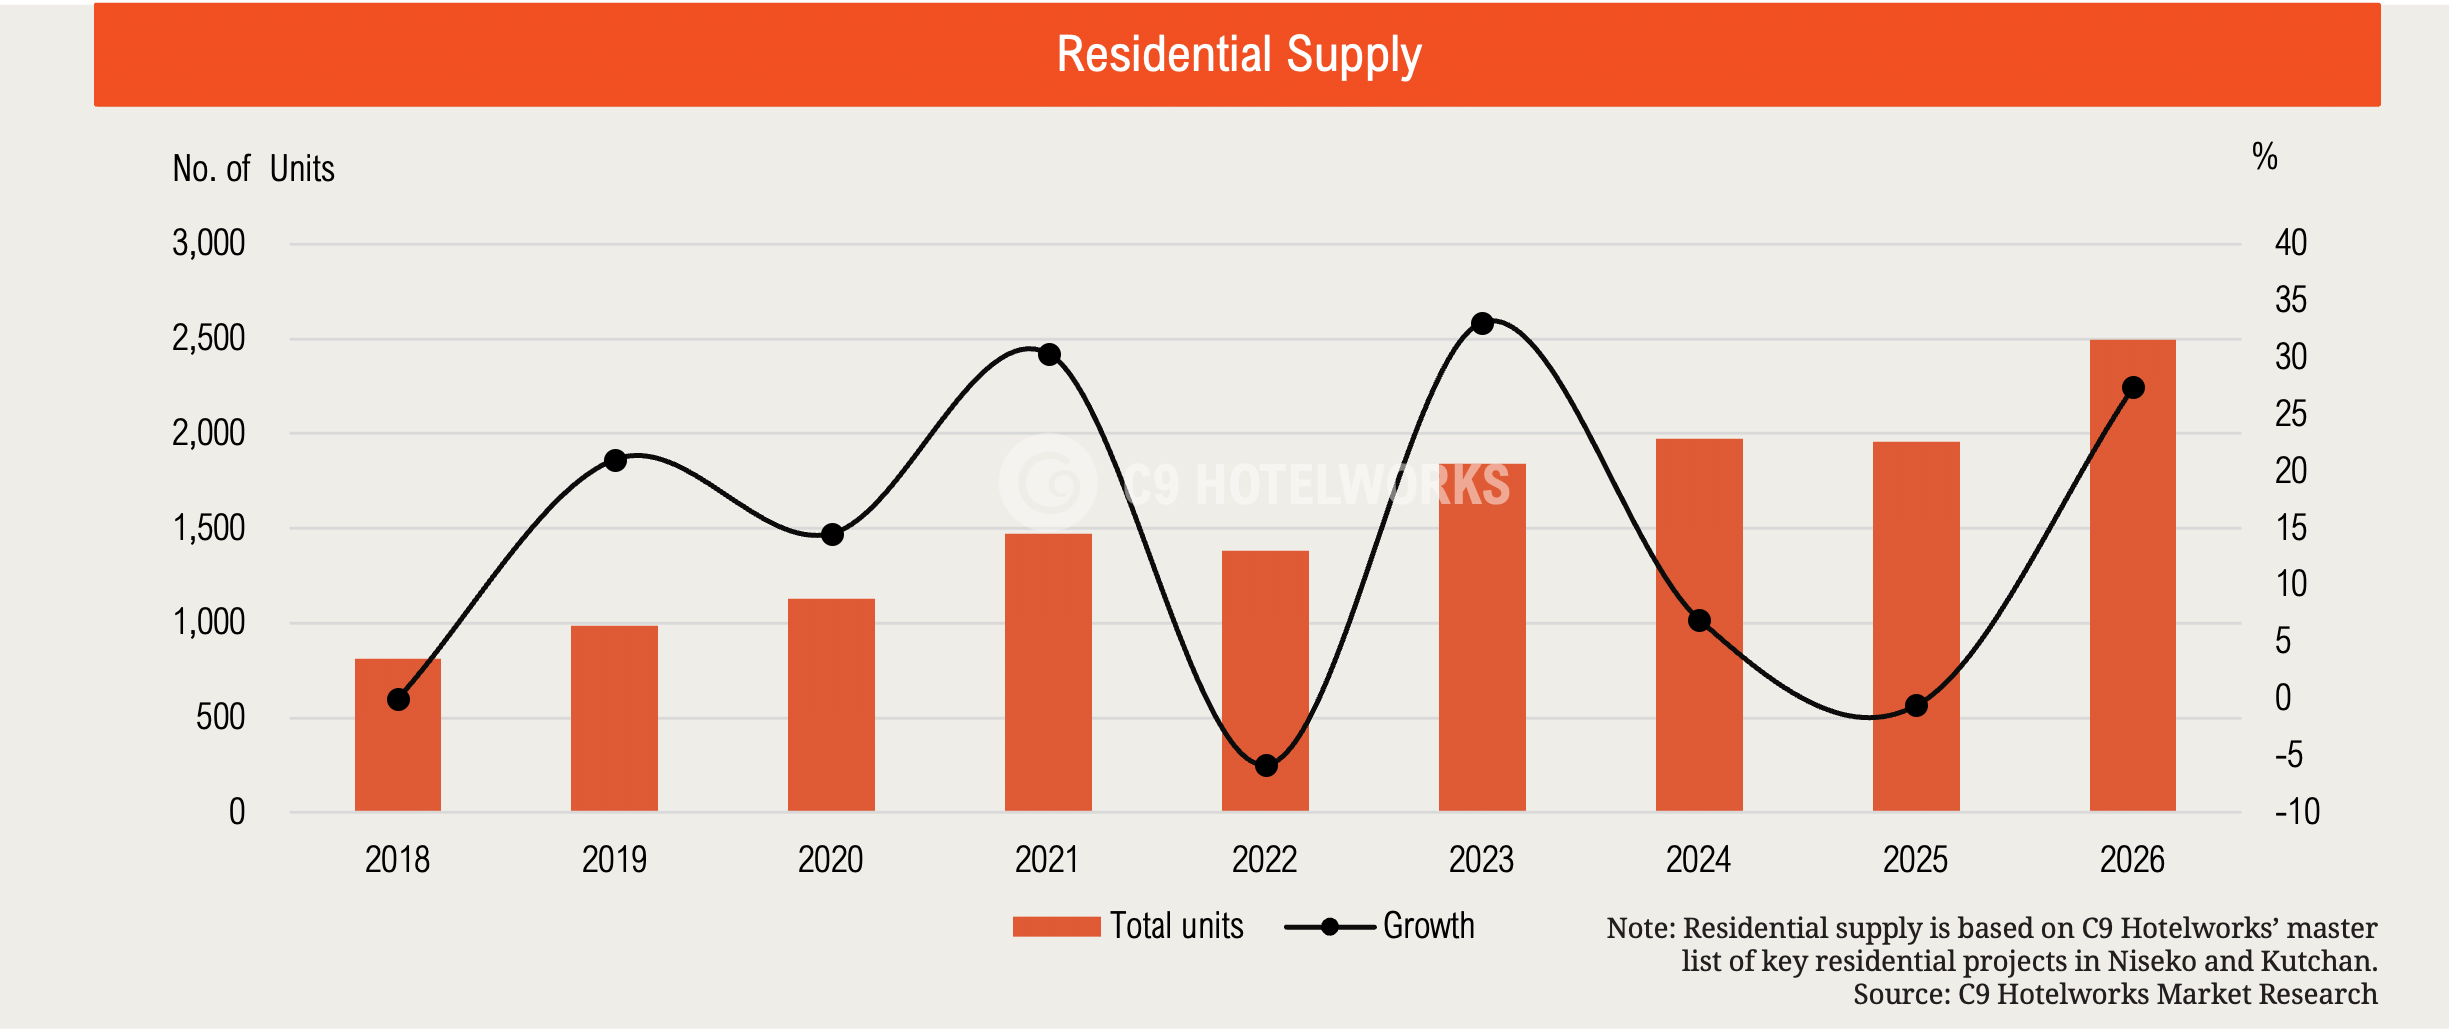
Residential supply reached approximately 2,500 units in 2026, up 27.6% year-on-year after a 0.6% decline in 2025. This was the strongest annual increase since 2023 and lifted supply to the highest level in the 2018 to 2026 period, against 813 units in 2018.
Condominiums accounted for 69% of supply, followed by land plots at 23% and villas at 8%. Hirafu and Outer Hirafu represented 63% of supply and Hanazono 27%, together with 90% of the primary market. Niseko Village follows at 7%, keeping new supply concentrated in Niseko’s main resort areas.
4. Hotel Supply Rises 46% as New Air Access Arrives
Hotel supply rises from 1,727 keys at the end of 2025 to 2,519 by the end of 2026, a 46% increase. Moxy Niseko Village added 310 keys in September 2026 and Hotel101 Niseko adds 482 keys in December 2026, together 792 keys. The scale of the increase makes demand outside the winter peak more important to Niseko hotel performance.
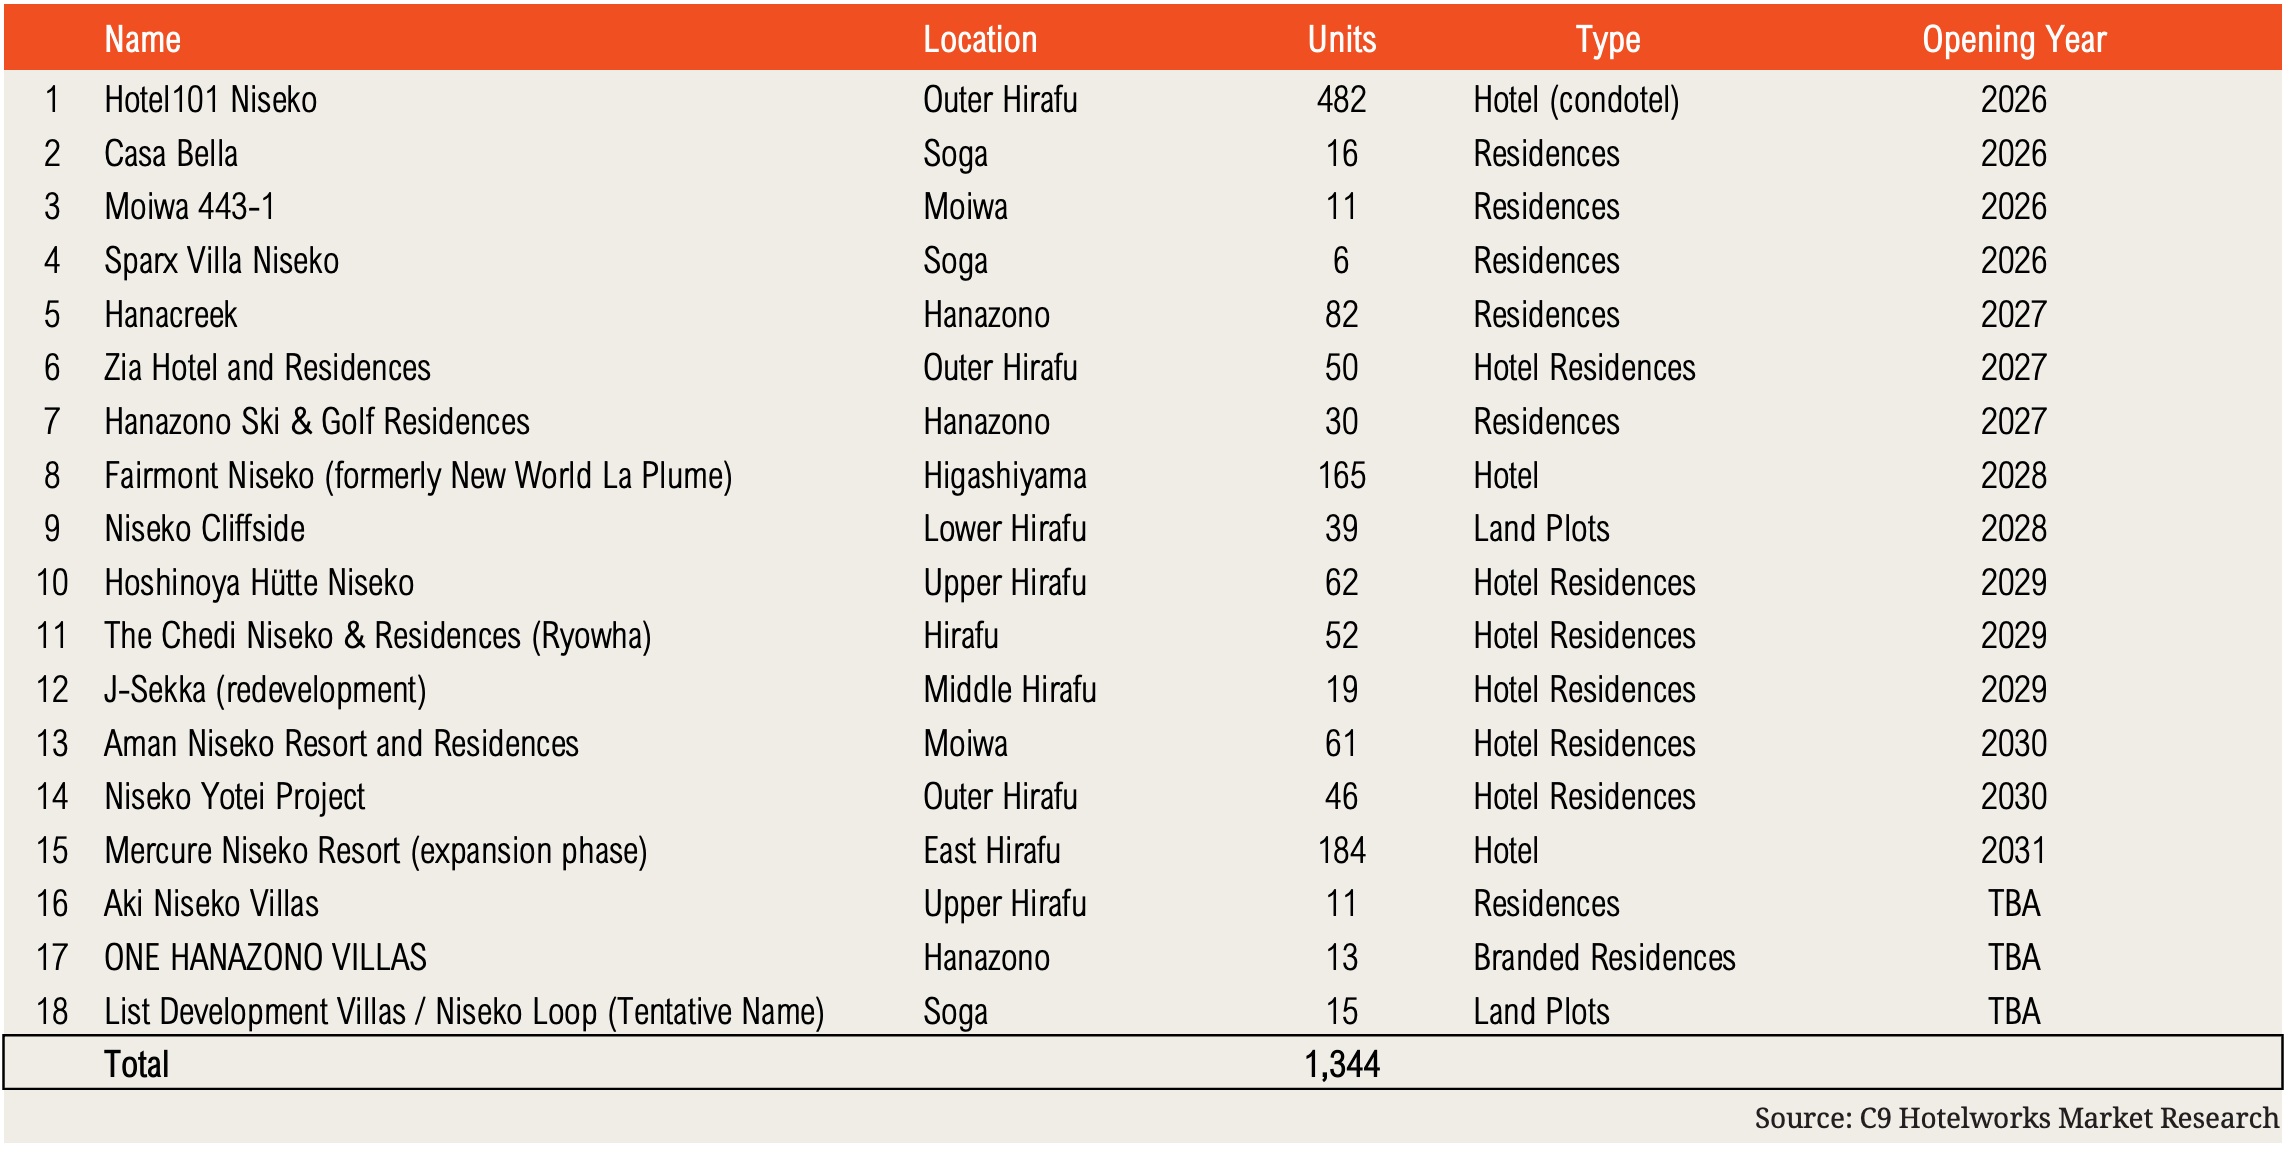
Winter 2026/27 brings United Airlines from San Francisco and Air Canada from Vancouver at three weekly flights each, from 11 and 17 December 2026. STARLUX Airlines open a five-weekly Taichung route on 2 October 2026. Niseko Town’s accommodation tax moves from a fixed nightly charge to 3% of the room rate on 1 November 2026, and the peak-season day pass rises 12.5%. Projects with stated opening years through 2031 total 1,344 units, comprising 831 hotel keys, 290 units across six Hotel Residences projects, 145 residence units and 39 land plots. Of the hotel keys, 482 open in December 2026 and a further 349 follow between 2028 and 2031, led by Fairmont Niseko, Hoshinoya Hütte Niseko, The Chedi Niseko & Residences and Aman Niseko Resort and Residences.
Hashtags: #NisekoProperty #JapanHotels #HotelInvestment #C9Insider
The Japan Branded Residences Market Snapshot 2026 provides an overview of the country’s branded residences market. In 2026, the market reached JPY487.1 billion (USD3 billion) in value across 1,012 launched units, at an average unit sales price of JPY481.3 million (USD3 million), with supply concentrated in resort condominium developments across Hokkaido and Okinawa.
Key Sections Covered
- Market Value, Launched Units and Unit Pricing
- Development Type and Chain Scale Positioning
- Supply by Product Type
- Regional Supply Distribution and Resort versus Urban Split
Supply Concentrates in Resort Destinations, Led by Standalone and Luxury Tier Developments
Japan’s branded residences market reached JPY487.1 billion (USD3 billion) across 1,012 launched units in 2026, with an average unit sales price of JPY481.3 million (USD3 million).
Across Asia, the branded residences market reached USD40 billion in 2026, up 30.3% year-on-year from USD30.7 billion. Japan recorded the second-highest average unit sales price in the region after the Maldives.
Total supply comprises 1,917 units across 19 properties. Condominiums account for 87% of supply, followed by hybrid products at 8% and landed properties at 5%. Luxury-tier developments represent 68% of properties, or 13 of the 19 projects.
The development mix is led by standalone developments at 40% of total supply (766 units), ahead of developments co-located with a hotel at 37% and mixed-use at 23%, making Japan one of Asia’s most standalone-led branded residences markets.
Resort destinations represent 91% of Japan’s branded residence supply, compared with 9% in urban markets. Hokkaido holds the largest share at 68% of total supply (1,299 units). Within Hokkaido, Niseko accounts for 1,095 units, or 57% of national supply, where Aman, Capella and One&Only are the leading brands. Okinawa follows at 19% (356 units) and Chūbu at 4% (89 units). Kantō accounts for the remaining 9% (173 units), all of it in Tokyo, which is Japan’s only urban branded residences market.
The Thailand Branded Residences Market Review 2026 provides an overview of the country’s branded residences market. In 2026, the market reached THB205.3 billion (USD6.4 billion) in value across 13,124 launched units, a 13.2% year-on-year increase, with supply concentrated in condominium developments across Bangkok, Phuket and Hua Hin.
Key Sections Covered
- Market Value, Launched Units and Asia Market Position
- Development Type and Chain Scale Positioning
- Supply by Product Type
- Destination Supply Distribution and Resort versus Urban Split
Supply Concentrates in Bangkok and Phuket, Led by Condominium and Luxury Developments
Thailand’s branded residences market reached THB205.3 billion (USD6.4 billion) across 13,124 launched units in 2026, a 13.2% year-on-year increase. Within Asia’s USD40 billion branded residences market, up 30.3% year-on-year from USD30.7 billion, Thailand ranks second by market value after Vietnam.
Total supply comprises 13,947 units across 63 properties, with condominiums accounting for 96% of supply, followed by landed properties at 3% and hybrid products at 1%. By chain scale, the luxury class accounts for 48% of developments, or 30 of the 63 properties. Thailand has the highest number of luxury branded residence properties in Asia, ahead of Vietnam with 19 and South Korea with 13.
Standalone branded residences account for 3,008 units, or 22% of total supply, ahead of the 17% Asia average. Thailand also has three non-hospitality branded residence properties, including Porsche Design Tower Bangkok and design- and fashion-branded developments in Phuket.
Resort destinations account for 64% of total supply (8,916 units), compared with 36% in urban destinations. Bangkok leads all destinations at 5,031 units and accounts for the whole of the urban segment. Among resort destinations, Phuket leads with 3,465 units, followed by Hua Hin with 3,017 units, Pattaya with 1,775 units and Koh Samui with 480 units. A further 179 units are distributed across Khao Yai, Rayong, Nakhon Si Thammarat and Phang Nga.
The Indonesia Branded Residences Market Review 2026 provides an overview of the country’s branded residences market. In 2026, the market reached IDR24.7 trillion (USD1.4 billion) in value across 1,145 launched units, with supply concentrated in Bali and a rising share of freehold product.
Key Sections Covered
- Market Value, Launched Units and Asia Market Position
- Supply by Product Type and Hybrid Share
- Bali Market Spotlight and Supply Concentration
- Ownership Structure and Regulatory Change
Supply Concentrates in Bali, Led by Condominium Developments and Hybrid Product
Indonesia’s branded residences market reached IDR24.7 trillion (USD1.4 billion) across 1,145 launched units in 2026. Within Asia’s USD40 billion branded residences market, up 30.3% year-on-year from USD30.7 billion across 50,025 launched units, Indonesia accounts for 3.5% of regional market value and 2.3% of launched units.
Hybrid product accounts for 34% of Indonesia’s supply, the highest share in Asia. Bali accounts for 25% of national branded residence market value, with condominiums representing 82% of the island’s branded residence product and villas accounting for the remaining 18%.
Bali carries more than 70 hotel residences developments on active sale, with branded residences accounting for approximately 10% of the island’s active supply. Supply concentrates in Canggu and Berawa, Uluwatu, Seminyak and Sanur.
Freehold supply rose from 12% in 2025 to 23% in 2026, close to double year-on-year. The March 2026 short-term rental compliance deadline and tighter foreign ownership requirements are increasing the importance of professionally managed and regulatory-compliant residential products.
The Philippines Branded Residences Market Snapshot 2026 provides an overview of the country’s branded residences market. In 2026, the market reached PHP235.5 billion (USD3.8 billion) in value across 7,433 launched units, with supply concentrated in condominium developments across Metro Manila and Metro Cebu.
Investor Highlights
- Market Value, Launched Units and Unit Pricing
- Development Type and Chain Scale Positioning
- Supply by Product Type and Destination
- Metro Manila and Metro Cebu Supply Concentration
Supply Concentrates in Major Cities, Led by Mixed-Use and Upscale Developments
The Philippines’ branded residences market reached PHP235.5 billion (USD3.8 billion) across 7,433 launched units in 2026, the third-largest launched supply in Asia after Thailand and Vietnam. Within Asia’s USD40 billion branded residences market, up 30.3% year-on-year across 50,025 launched units, the Philippines ranks third by launched units yet fifth by market value, at an average USD514,000 per unit.
Supply is 97% condominiums, while landed properties and hybrid products remain the minority. By chain scale, the upscale tier holds the largest share at 66% of developments, while the luxury tier accounts for 26% of the 38 properties. The weighting toward upscale over luxury reinforces the market’s accessible, volume-driven positioning.
The development mix is led by mixed-use at 40% of units (4,866 units), ahead of projects co-located with a hotel at 33% and standalone at 27%, making Philippines one of Asia’s highest shares of mixed-use branded residences
Supply concentrates in the two largest metropolitan areas. Metro Manila leads with 39% of national supply (4,814 units) and Metro Cebu follows at 28%, together accounting for two-thirds of the Philippines’ 12,299 total supply units.
As high barriers to entry and a shortage of iconic locations push luxury developers to look beyond Phuket for top-end sites, ultra-luxury development is shifting north into Phang Nga’s oceanfront. The Khao Lak and Phang Nga Hotel & Tourism Market Review 2026 examines this shift across the province and its Khao Lak resort cluster. In Khao Lak, hotel performance trends are led by rate, with the average daily rate (ADR) up 26.2% year-on-year in the first quarter of 2026. Phang Nga tourism revenue reached THB56.6 billion (USD1.7 billion) in 2025 on 4.3 million visitor arrivals.
Key Sections Covered
- Khao Lak Hotel Performance Trends
- Phang Nga Tourism Demand, Visitor Arrivals and Tourism Revenue
- Phang Nga Southern Provinces Ranking
- Outlook and Phang Nga Hotel Pipeline
Investor Highlights
1. Khao Lak Hotel Performance Trends are Led by Rate, Not Volume
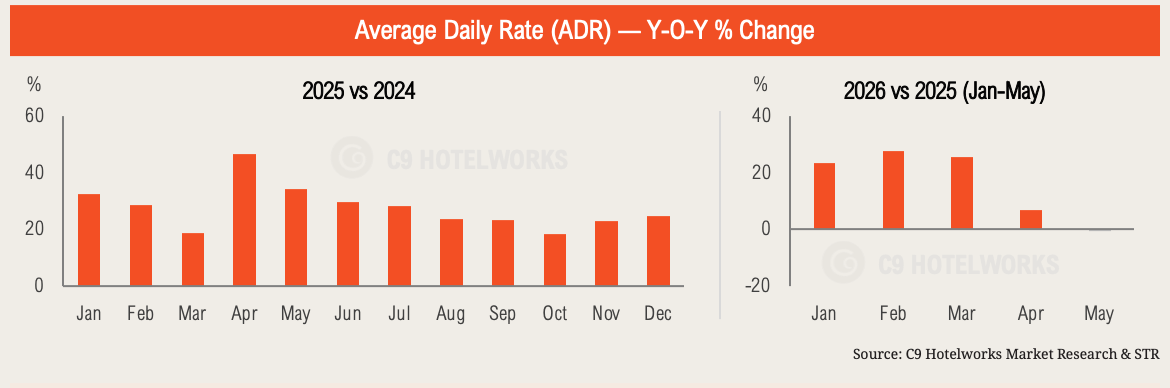
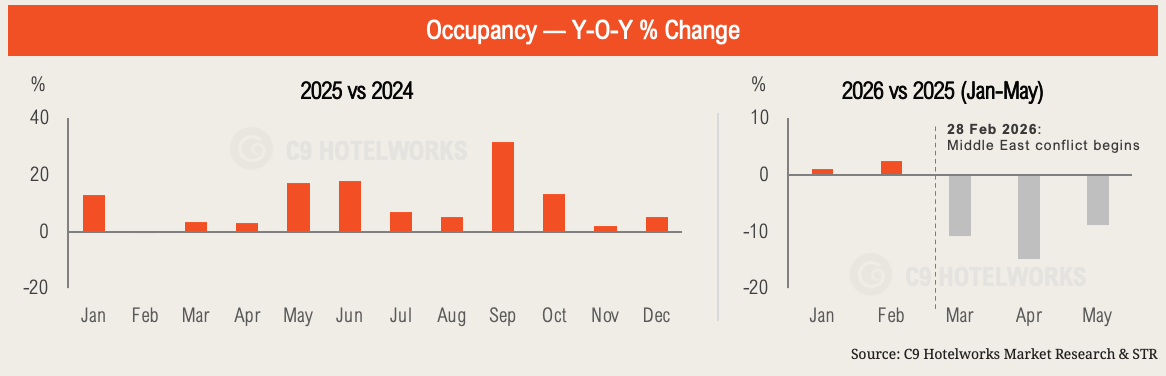
Average daily rate rose 26.2% year-on-year in the first quarter of 2026, extending 2025 gains, when monthly increases ranged from 18.2% to 46.4%. Occupancy, by contrast, turned negative year-on-year from March 2026, and revenue per available room (RevPAR) turned negative in April and May as the Middle East conflict and higher airfares softened international demand.
2. Visitor Arrivals Held Steady as the Wider Southern Region Contracted
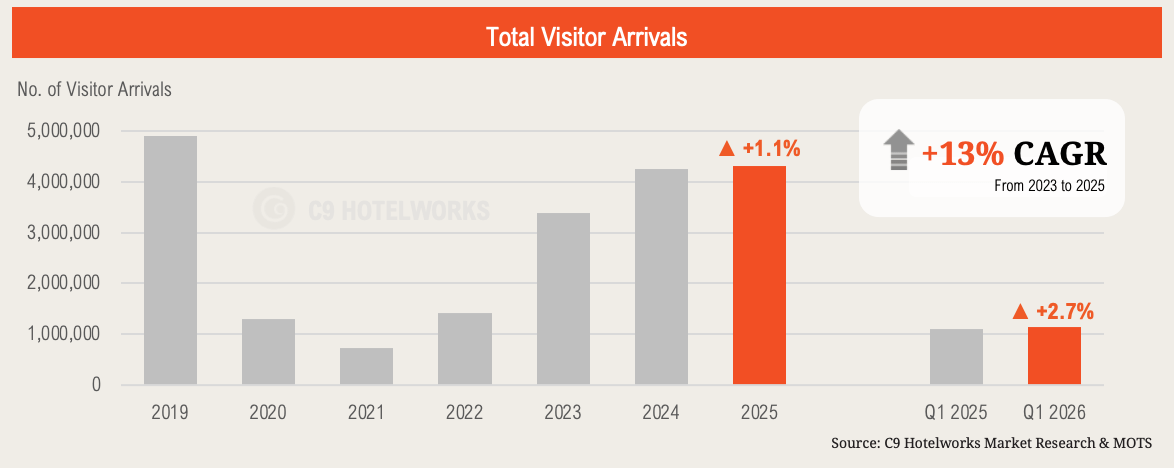
Phang Nga visitor arrivals reached 4.3 million in 2025, up 1.1% year-on-year and a 13% compound annual growth rate (CAGR) from 2023 to 2025, while Thailand’s Southern region (14 provinces) decreased by 0.6% over the same period. Tourism revenue rose 2% to THB56.6 billion (USD1.7 billion), ahead of the 1.1% increase in visitor arrivals.
The 2025 gain was domestic-led: international visitor arrivals held at 2.61 million, down 0.2%, while domestic visitor arrivals rose 3.2% to 1.7 million. Visitor arrivals rose a further 2.7% year-on-year in the first quarter of 2026, before international demand softened from March.
3. Phang Nga Ranks Fourth by Revenue but Sixth by Visitor Volume
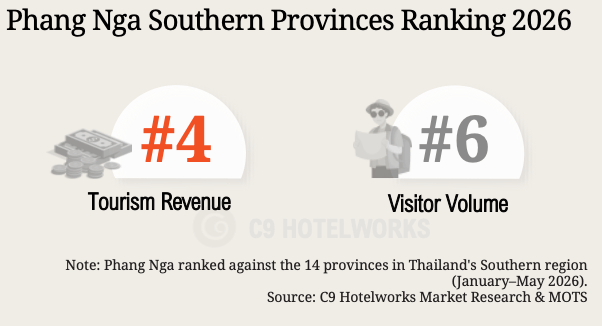
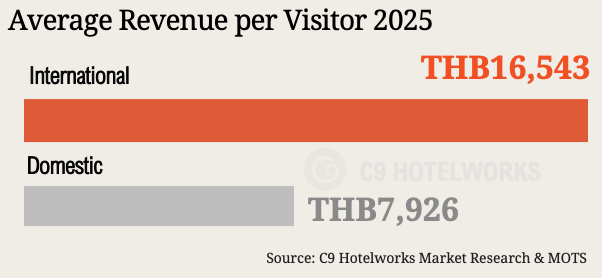
As of May 2026, Phang Nga ranked fourth of the 14 provinces in Thailand’s Southern region by tourism revenue, behind Phuket, Surat Thani and Krabi, but sixth by visitor volume, a sign of higher spending per visitor. In 2025, international visitors made up 61% of visitor arrivals but 76% of revenue, spending more than double per head (THB16,543) than domestic visitors (THB7,926). With 2025 growth outpacing a contracting region, this top-end positioning continues to draw luxury developers north from Phuket into Phang Nga.
4. The Outlook Points to Top-End Development Shifting North from Phuket into Phang Nga
As high barriers to entry and a shortage of iconic locations push luxury developers to look beyond Phuket for top-end sites, ultra-luxury development is shifting into Phang Nga Bay and the coastline north of the Sarasin Bridge, from Natai to Thai Muang, where oceanfront sites support full-service resorts rather than commoditized, box-type product. The active pipeline consists of 315 keys, led by the InterContinental Phang-Nga Bay Resort (150 keys, 2028) and Kimpton Natai (150 keys, 2027), alongside a 15-key expansion of Khaolak Paradise Resort in 2026.
Meanwhile, Khao Lak is maturing as a market, helped by four-lane access from Phuket International Airport and the 170-hectare Matalay integrated resort community, featuring five international-standard resort sites.
The Malaysia Branded Residences Market Review 2026 examines where Malaysia sits within Asia’s record USD40 billion branded residences market. Malaysia ranks fifth in Southeast Asia by market value, at USD1.9 billion across 4,183 launched units. Supply remains modest and urban-led, the resort segment is largely untapped, and the next growth cycle is building in Johor, backed by record state investment and new infrastructure.
Key Sections Covered
- Asia Branded Residences Market Overview and Malaysia’s Ranking
- Malaysia Supply Distribution and Chain Scale
- Branded Residence Sale Prices Across the Region
- Real Estate Demand and Price Bands
- Growth Drivers and the Investment Landscape
- Malaysia Outlook
Investor Highlight
1. Malaysia Ranks Fifth Among Southeast Asian Markets by Market Value
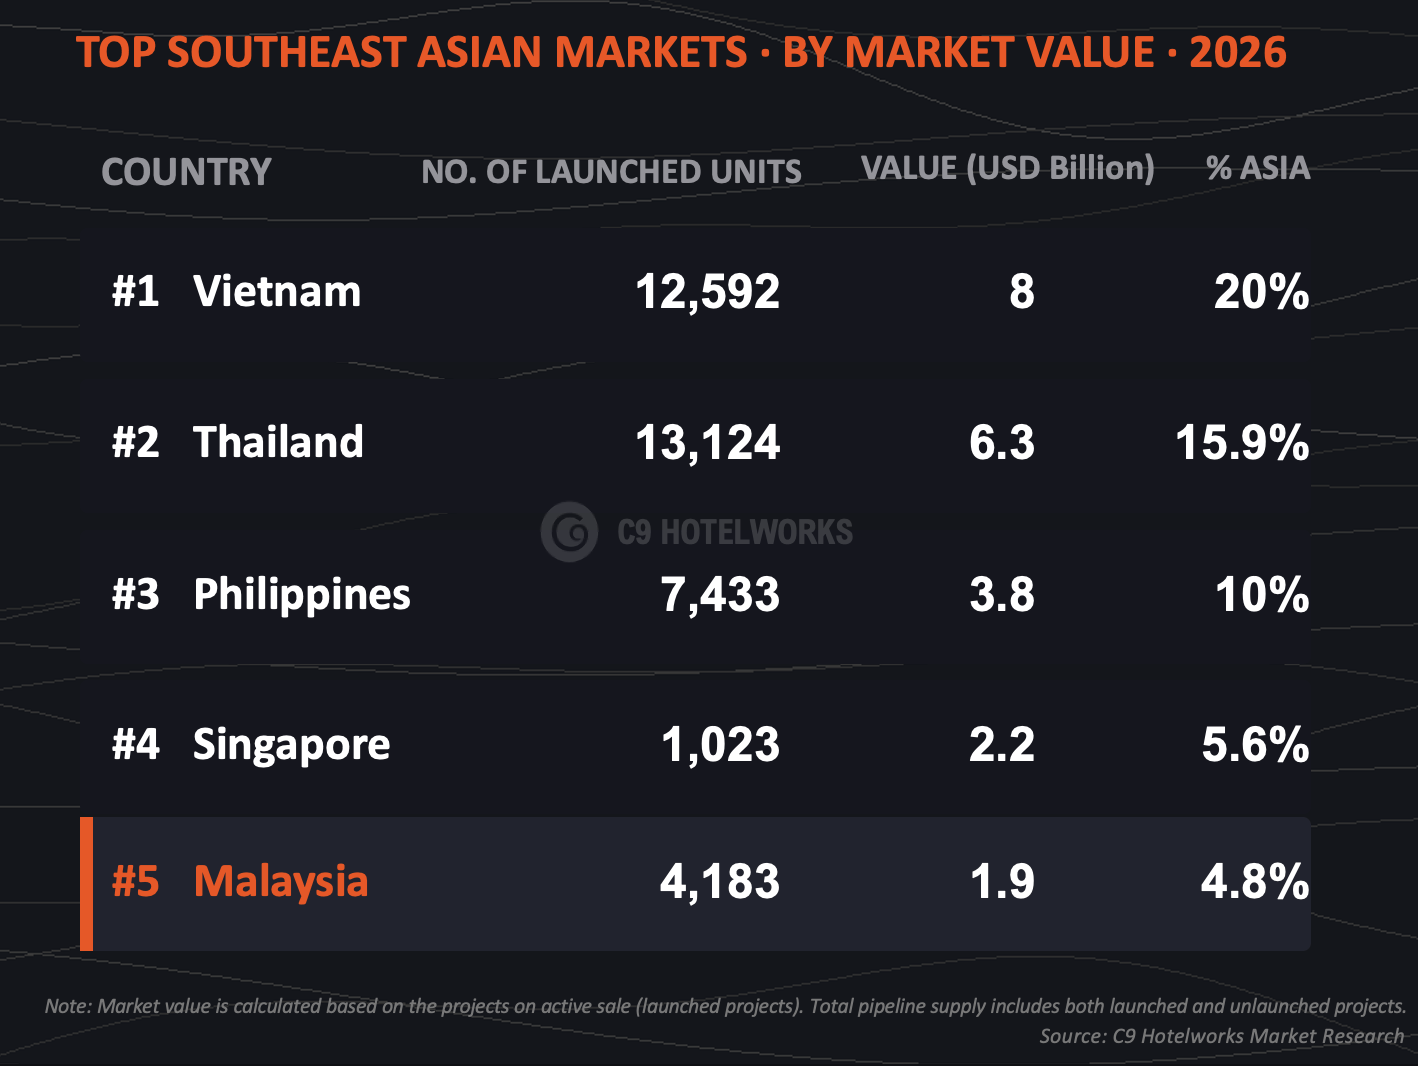
In 2026, Asia’s branded residences pipeline is valued at USD40 billion across 50,025 launched units, up 30.3% year-on-year, on a total pipeline of 64,581 units. Malaysia’s launched units carry a market value of USD1.9 billion, fifth among Southeast Asian markets by value, behind Vietnam, Thailand, the Philippines, and Singapore.
Malaysia’s total pipeline is 5,812 units (4,183 launched, 1,629 unlaunched), a 9% share of Asia by units. By market value it holds under 5% of the region, mid-sized by volume but below its regional peers by value.
2. Supply Is Concentrated, Urban-Led, and Anchored in the Upper Upscale Tier
Malaysia’s branded residences supply is urban-led (75%) and concentrated in condominiums (95%), led by Kuala Lumpur and Penang. This leaves the resort segment largely untapped.
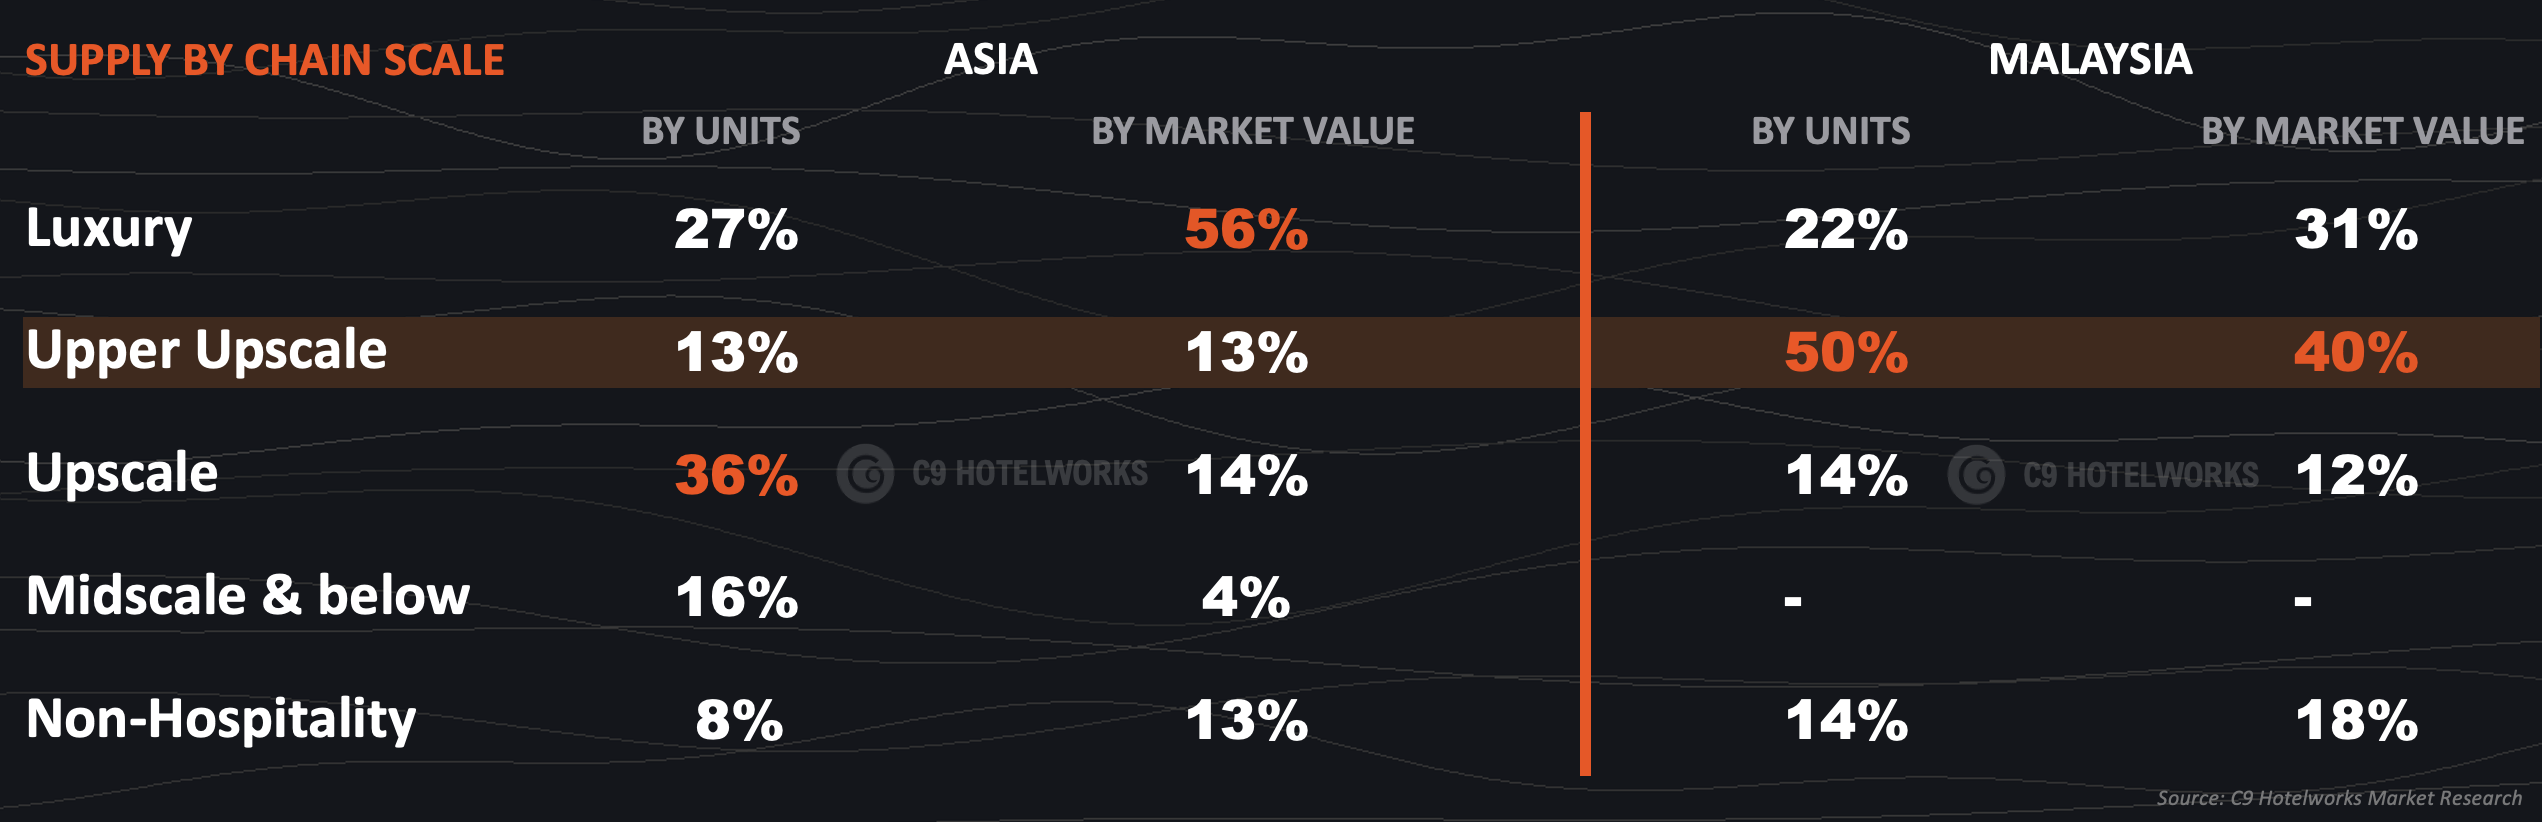
By chain scale, the upper upscale tier holds 50% of Malaysia’s branded units, against 13% across Asia. Malaysia is positioned a tier below the region, leaving room in the luxury tier, which remains thinner than the Asia benchmark.
3. Kuala Lumpur Is Competitively Priced Against the Region
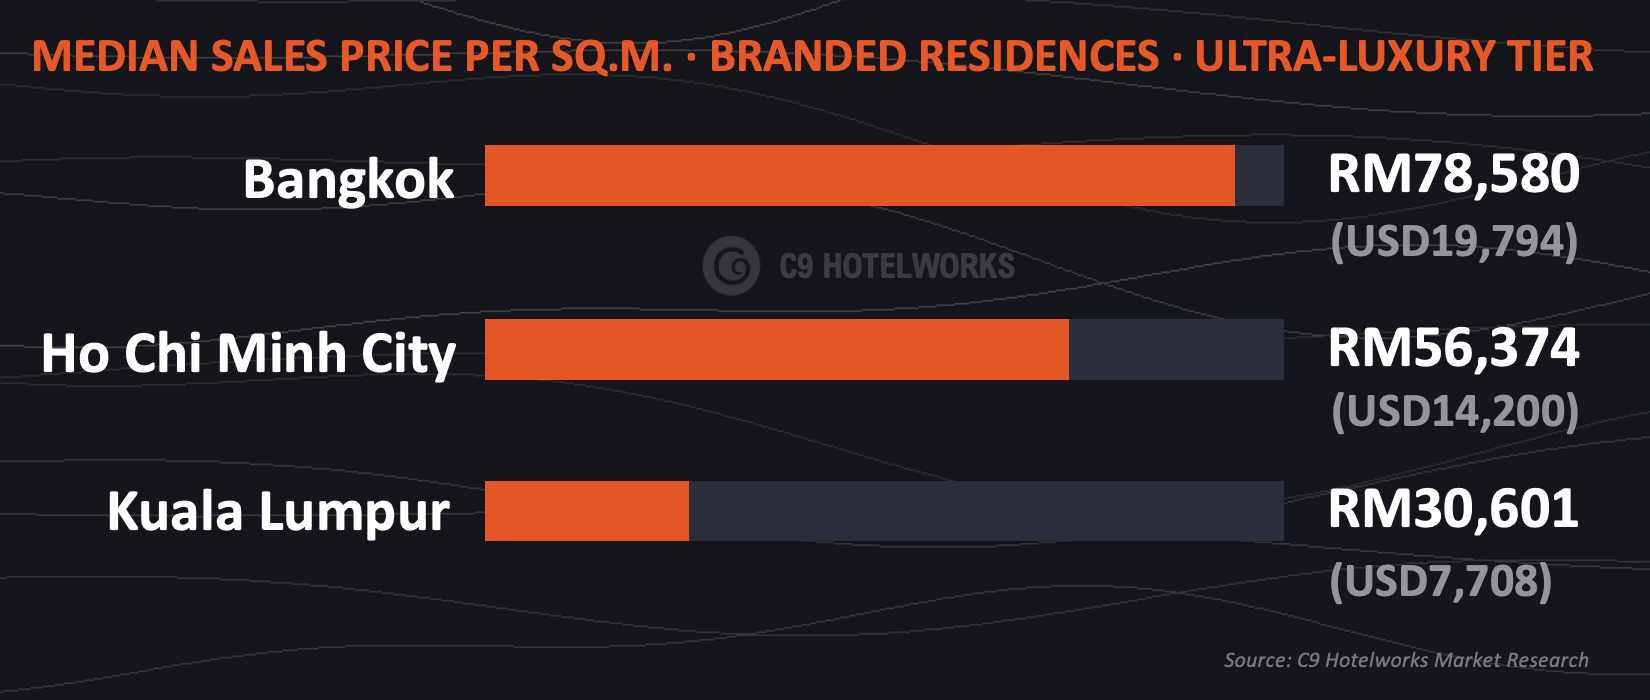
The median sales price per sq.m. for ultra-luxury branded residences places Kuala Lumpur at RM30,601 (USD7,708), against RM78,580 (USD19,794) in Bangkok and RM56,374 (USD14,200) in Ho Chi Minh City, a 2.6 times gap between Bangkok and Kuala Lumpur.
Malaysia My Second Home (MM2H) makes a property purchase compulsory, up to RM2 million at the top tier, which channels foreign demand toward the branded segment. The pricing position offers investors a value entry point relative to the region.
4. Domestic Demand Is Concentrating at the Top of the Market
In the residential market, transaction value rose 1.3% year-on-year in 2025 even as transaction volume fell 1.5%, across 256,512 deals worth RM108.3 billion. Regional activity skews south, with Southern (Johor) at 28% and Central at 27% holding the two largest shares.
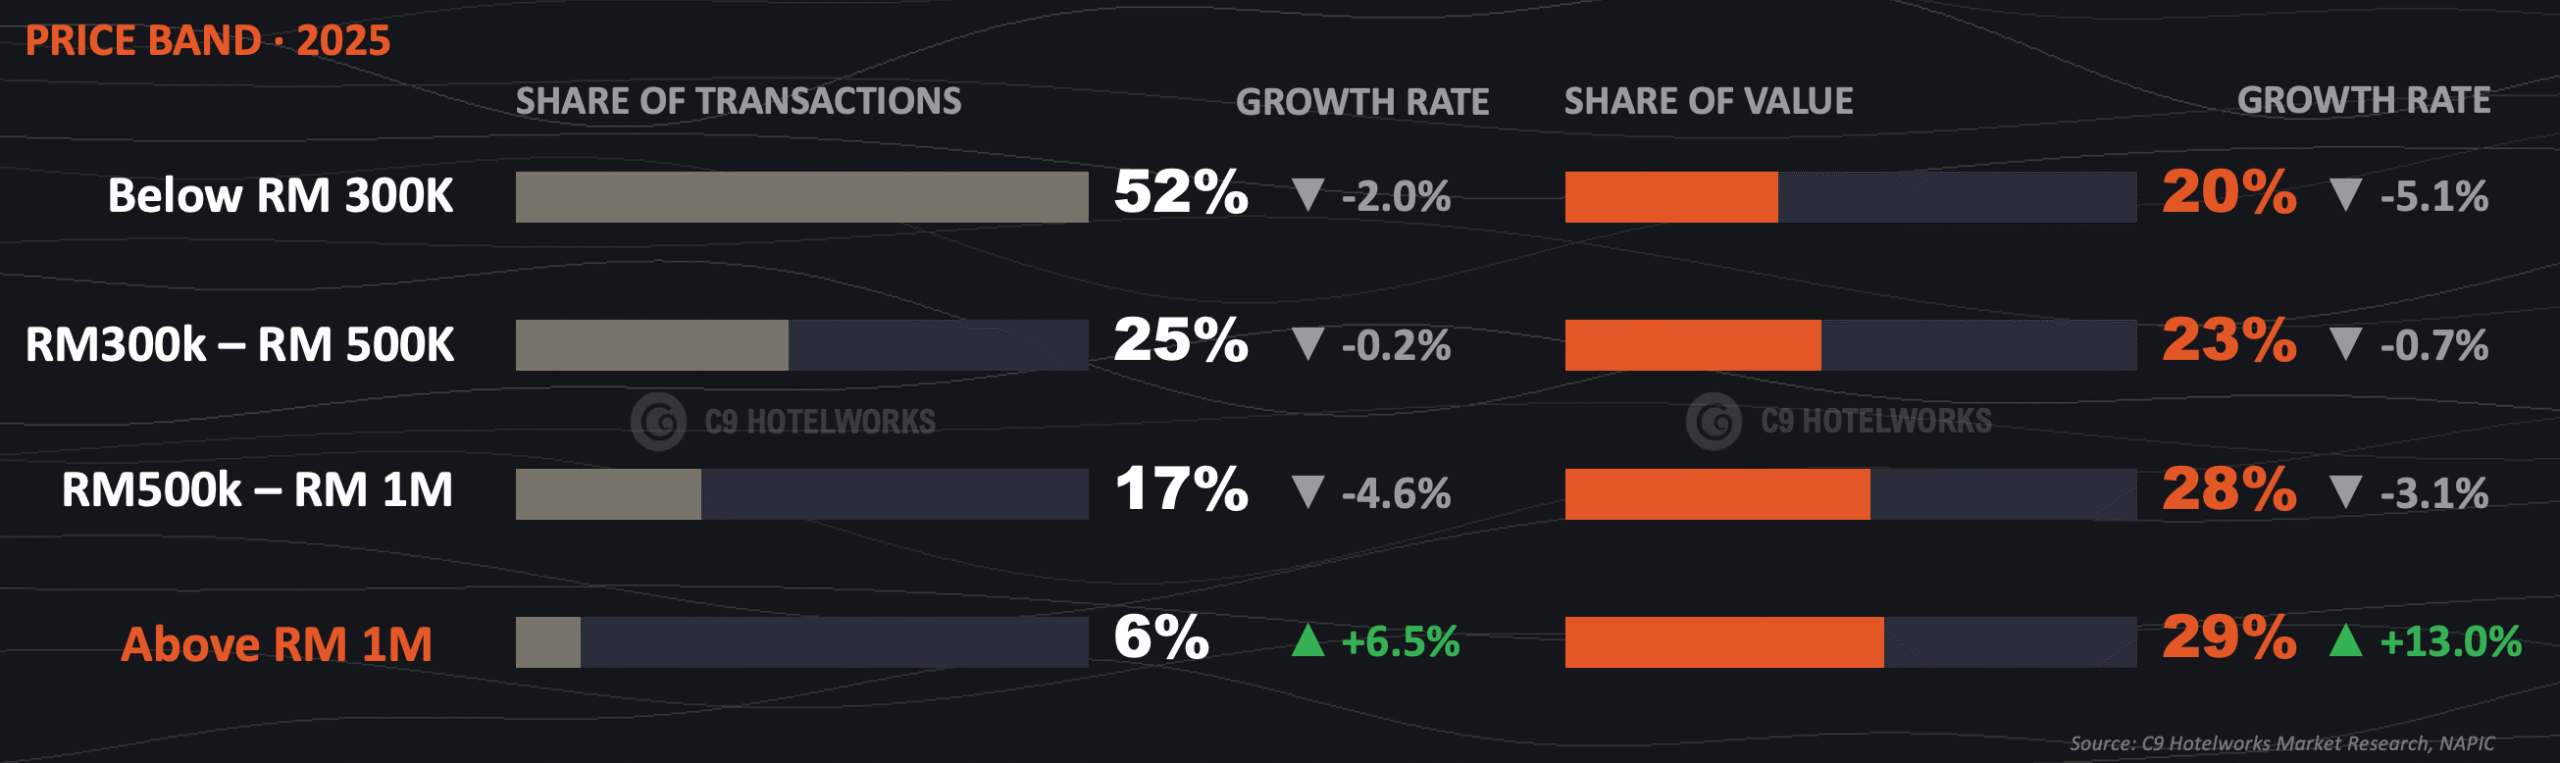
By price band, the RM1 million-plus band was the only band to grow, up 13% in value and 6.5% in volume, while every band below it contracted. Demand is concentrating in the tier where branded residences compete.
The Phuket International School Market Review 2026 analyses Phuket’s transition from a leisure destination to an international community. C9 Hotelworks research finds the sector will reach 18 international schools serving 5,075 students by August 2026, with a forecasted annual tuition value of THB2.5 billion (USD76.2 million).
Key Sections Covered
- Phuket International School Sector Expansion and Forecasted Annual Tuition
- Student Enrollment Growth
- International Source Market and Top International Nationalities
- Phuket’s GDP Contribution and Productivity Multiplier
- ED Guardian Visa and the Long Stay Family Residency Hub
- Strategic Advantages and Premium Infrastructure Pillars
- Bangtao / Cherngtalay: Phuket’s Leading International Lifestyle District
Investor Highlights
Phuket’s International School Sector Marks Its Transition from Leisure Destination to International Community
Phuket’s international school market has expanded 51% in three years and will reach 18 international schools by August 2026, with annual tuition forecasted at THB2.5 billion (USD76.2 million). It serves 5,075 students (2025/26) from more than 50 nationalities across global curricula. At Phuket’s three largest international schools (HeadStart, BISP, UWC Thailand), the foreign student mix is led by Russia (15%) and China (10%), followed by the UK and USA at 5% each.
Phuket performs at 2.2 times national productivity, accounting for 0.7% of Thailand’s population yet contributing 1.4% of national GDP. Six school openings or expansions between 2023 and 2026 represent significant capital commitments in a structurally resilient market.
The ED Guardian Visa grants one parent a renewable one-year residency per enrolled child, converting tourist families into long-stay residents. School enrollment locks in long-term housing demand from high-income families, directly feeding Phuket’s THB454.8 billion (USD14.1 billion) residential market.
Schools are also a precondition for foreign direct investment and the relocation of executives, joining branded residences, healthcare, and lifestyle retail as the four premium infrastructure pillars converging in Phuket. This convergence is most visible in Bangtao / Cherngtalay, Phuket’s leading international lifestyle district, which holds 54% of Phuket’s residences supply and 30% of the 2026–2030 hotel pipeline, and will add North London Collegiate School (NLCS), scheduled to open in 2028. International schools are a catalyst connecting people, capital, and opportunity for Phuket’s international community.